
The Forecaster is soft-deprecated. The Plans tool is a more powerful replacement of the Forecaster, and unless you know specifically that you need the Forecaster, it’s recommended that you start new workflows using Plans.
The forecaster is a tool for taking your planned spend and producing a forecast of your dependent variable. The Forecaster tool accounts for time shifts in your marketing channels, predicting revenue or conversions for the specified time period.
The plan builder interface allows you to interact with the forecaster and create your forecast more flexibly. This includes:
-
Forecasting in various timeframes
-
Forecasting using budgets in various stages of development
Inputs
Timeframe
The plan builder interface allows you to select from various planning timeframes. These include but are not limited to:
-
This Week
-
This Quarter
-
Next 30 days
-
Next 365 days
Input budget
The plan builder interface offers a variety of options for building your budget depending on how much you have planned your budget already such as:
Have Recast predict a baseline budget
If you have no budget prepared, Recast will “predict a baseline budget” using your past spend data.
Provide a total spend number
If you have a total budget but have not allocated it into your marketing channels, select this option. This will give a spend breakdown by channel based on your historical patterns of spend (Note: it does not optimize spend, it continues the historical patterns of spend that you have used. Please use the optimizer to generate an optimal spend recommended budget).
If the spend number you provide is too different from your historical spend, the model may not be able to accurately respect the constraint. We recommend staying within 1/3rd to 3x the normal spend amount for the number of days you selected.
Upload a budget
If you have a budget file in CSV format, select “Upload a budget”. Based on the completeness of your budget for the time period and the column names in your file, you may be directed to a mapping model where you can map the columns in your budget to the channels in your model.
Visit Create a Budget to learn more about how to create a budget using Recast.
Once you upload your budget, you can run the forecaster to see the predicted results of your marketing spend.
Lower-funnel channels
You will have the option of limiting lower-funnel spend in any of your lower funnel channels by clicking the box labeled “Do you want to limit spend in any lower funnel channels”:
-
“Uncapped” is the default — this will use Recast’s predictions of your spend in these channels
-
“Off” means that the channel will be treated as off and zero spend will be used in this channel
-
“Capped” will allow total spend across the entire period to be between 0 and the input cap
-
“Manual Override” uses the budget builder’s predicted values for the lower funnel channels. These do not depend on other marketing activities.
If your budget is missing channels that are included in your model, they are assumed to be zero. Channels present in your budget that are not in your model will be removed from your budget.
Spikes
By clicking “show” next to “Spikes”, you can add or delete spike dates that may impact your forecast.
In this case, the forecast will include the two dates in green for Black Friday. These may be deleted, or additional dates (e.g. for a “Promo”) may be added.
We recommend reviewing the 'spikes' tab when reviewing or re-running these forecasts, to ensure all future promotion dates are included - this is important for forecasting accuracy!
You can only adjust spikes 30+ days after last modeled date. If the last modeled date is on 8/22 - you cannot change a spike that is between 8/22 - 9/22 because that spike is technically already in the model.
Grayed-out dates may not be changed
Outputs
The Forecaster tool provides several outputs and downloads. The key ones are identified below:
Daily and Cumulative Forecasts
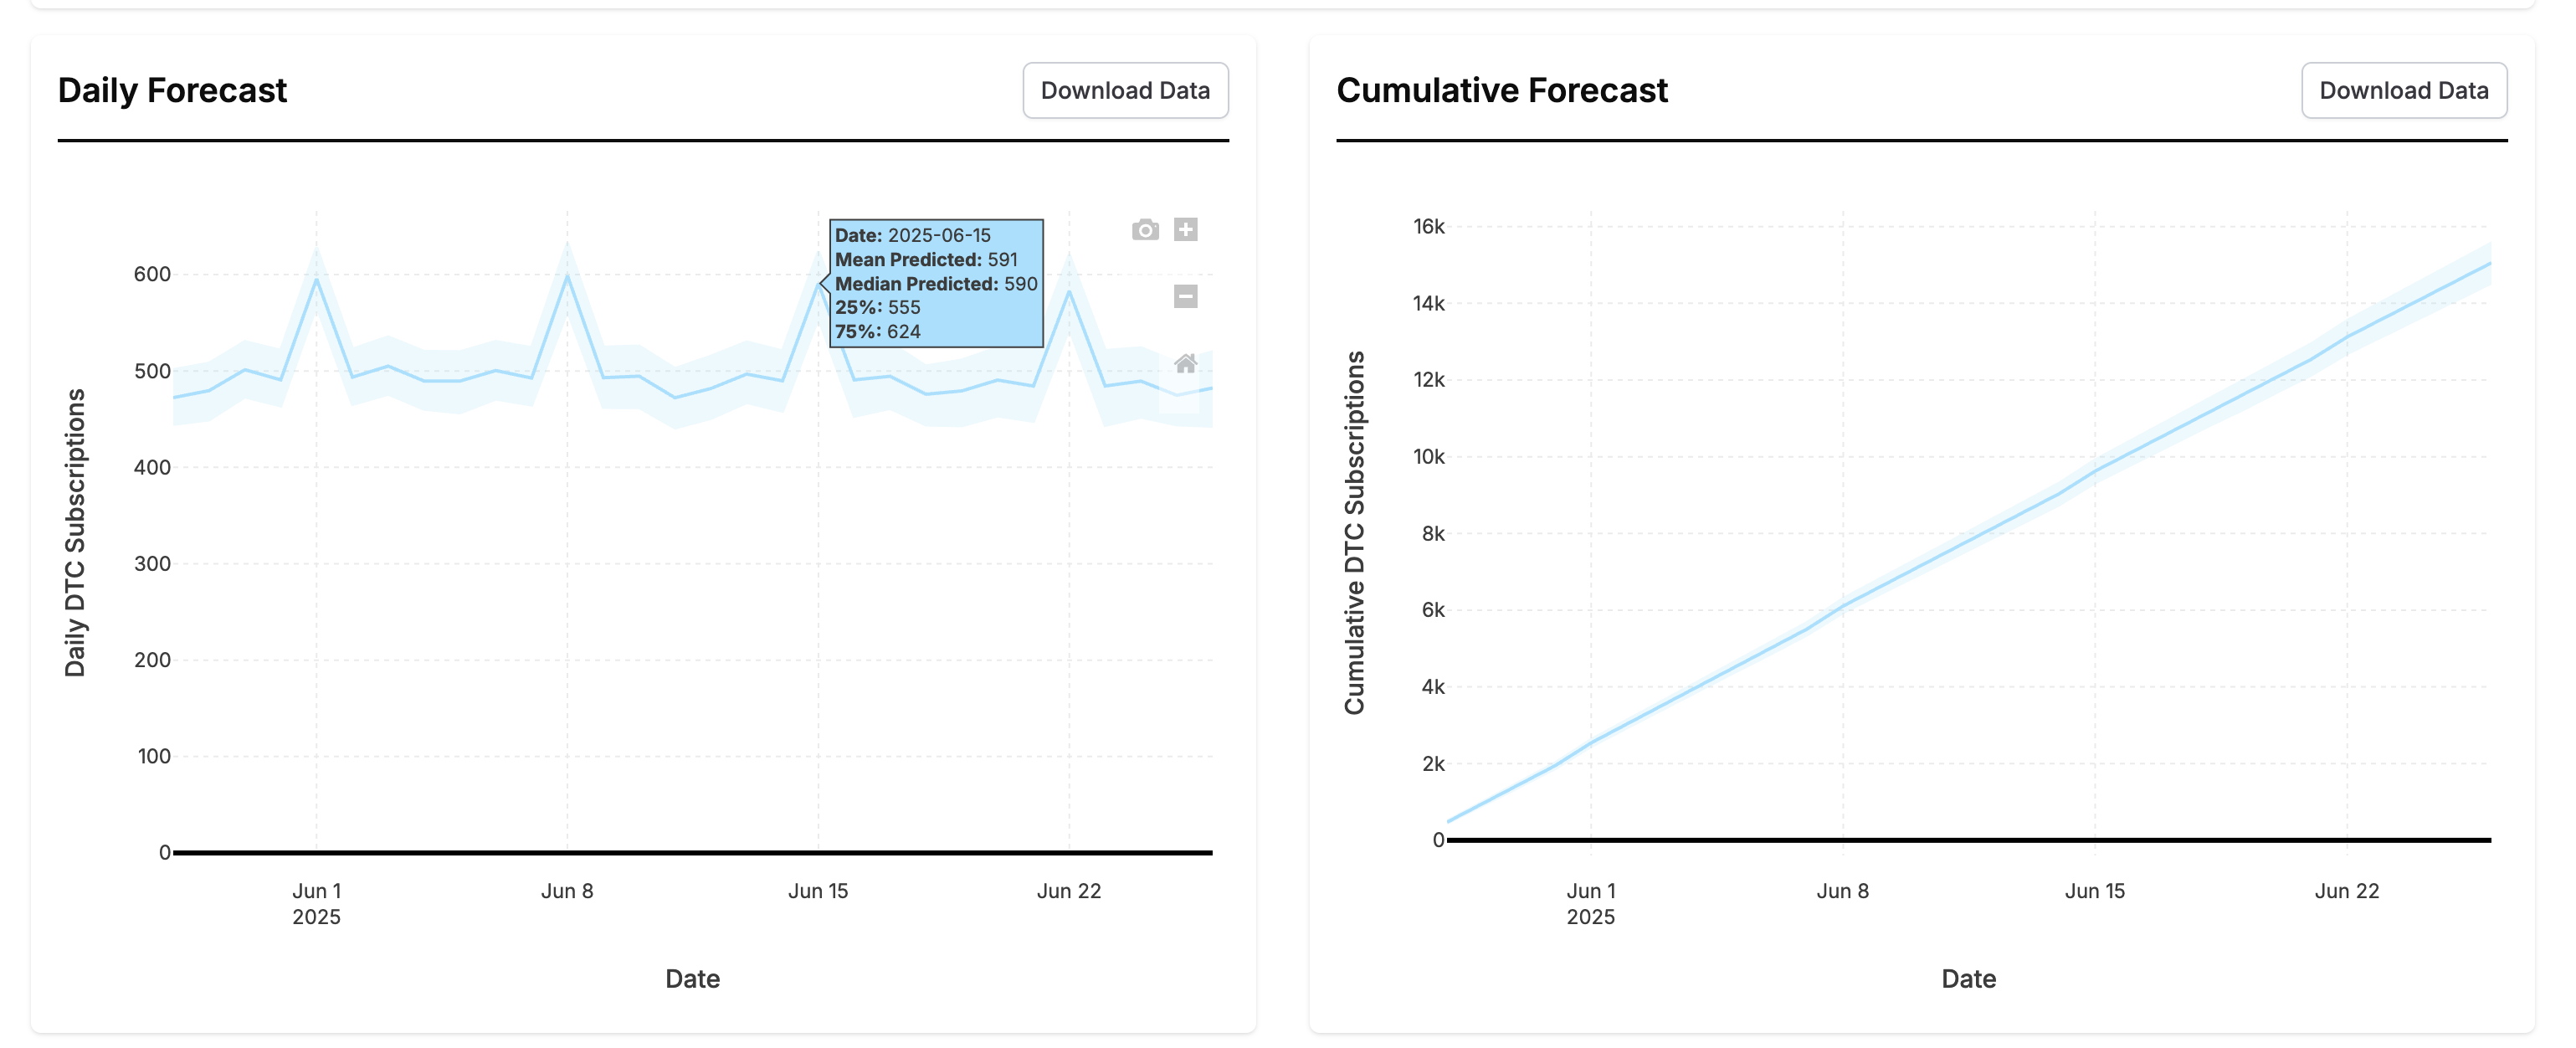
These plots show the day-by-day and cumulative-sum forecasts over the forecast window. The interval shown is the median +25 and +75 percentiles. This data, including additional percentiles, is available in the “Detailed Downloads” section under the “Forecast” label.
The Channel Summary Table
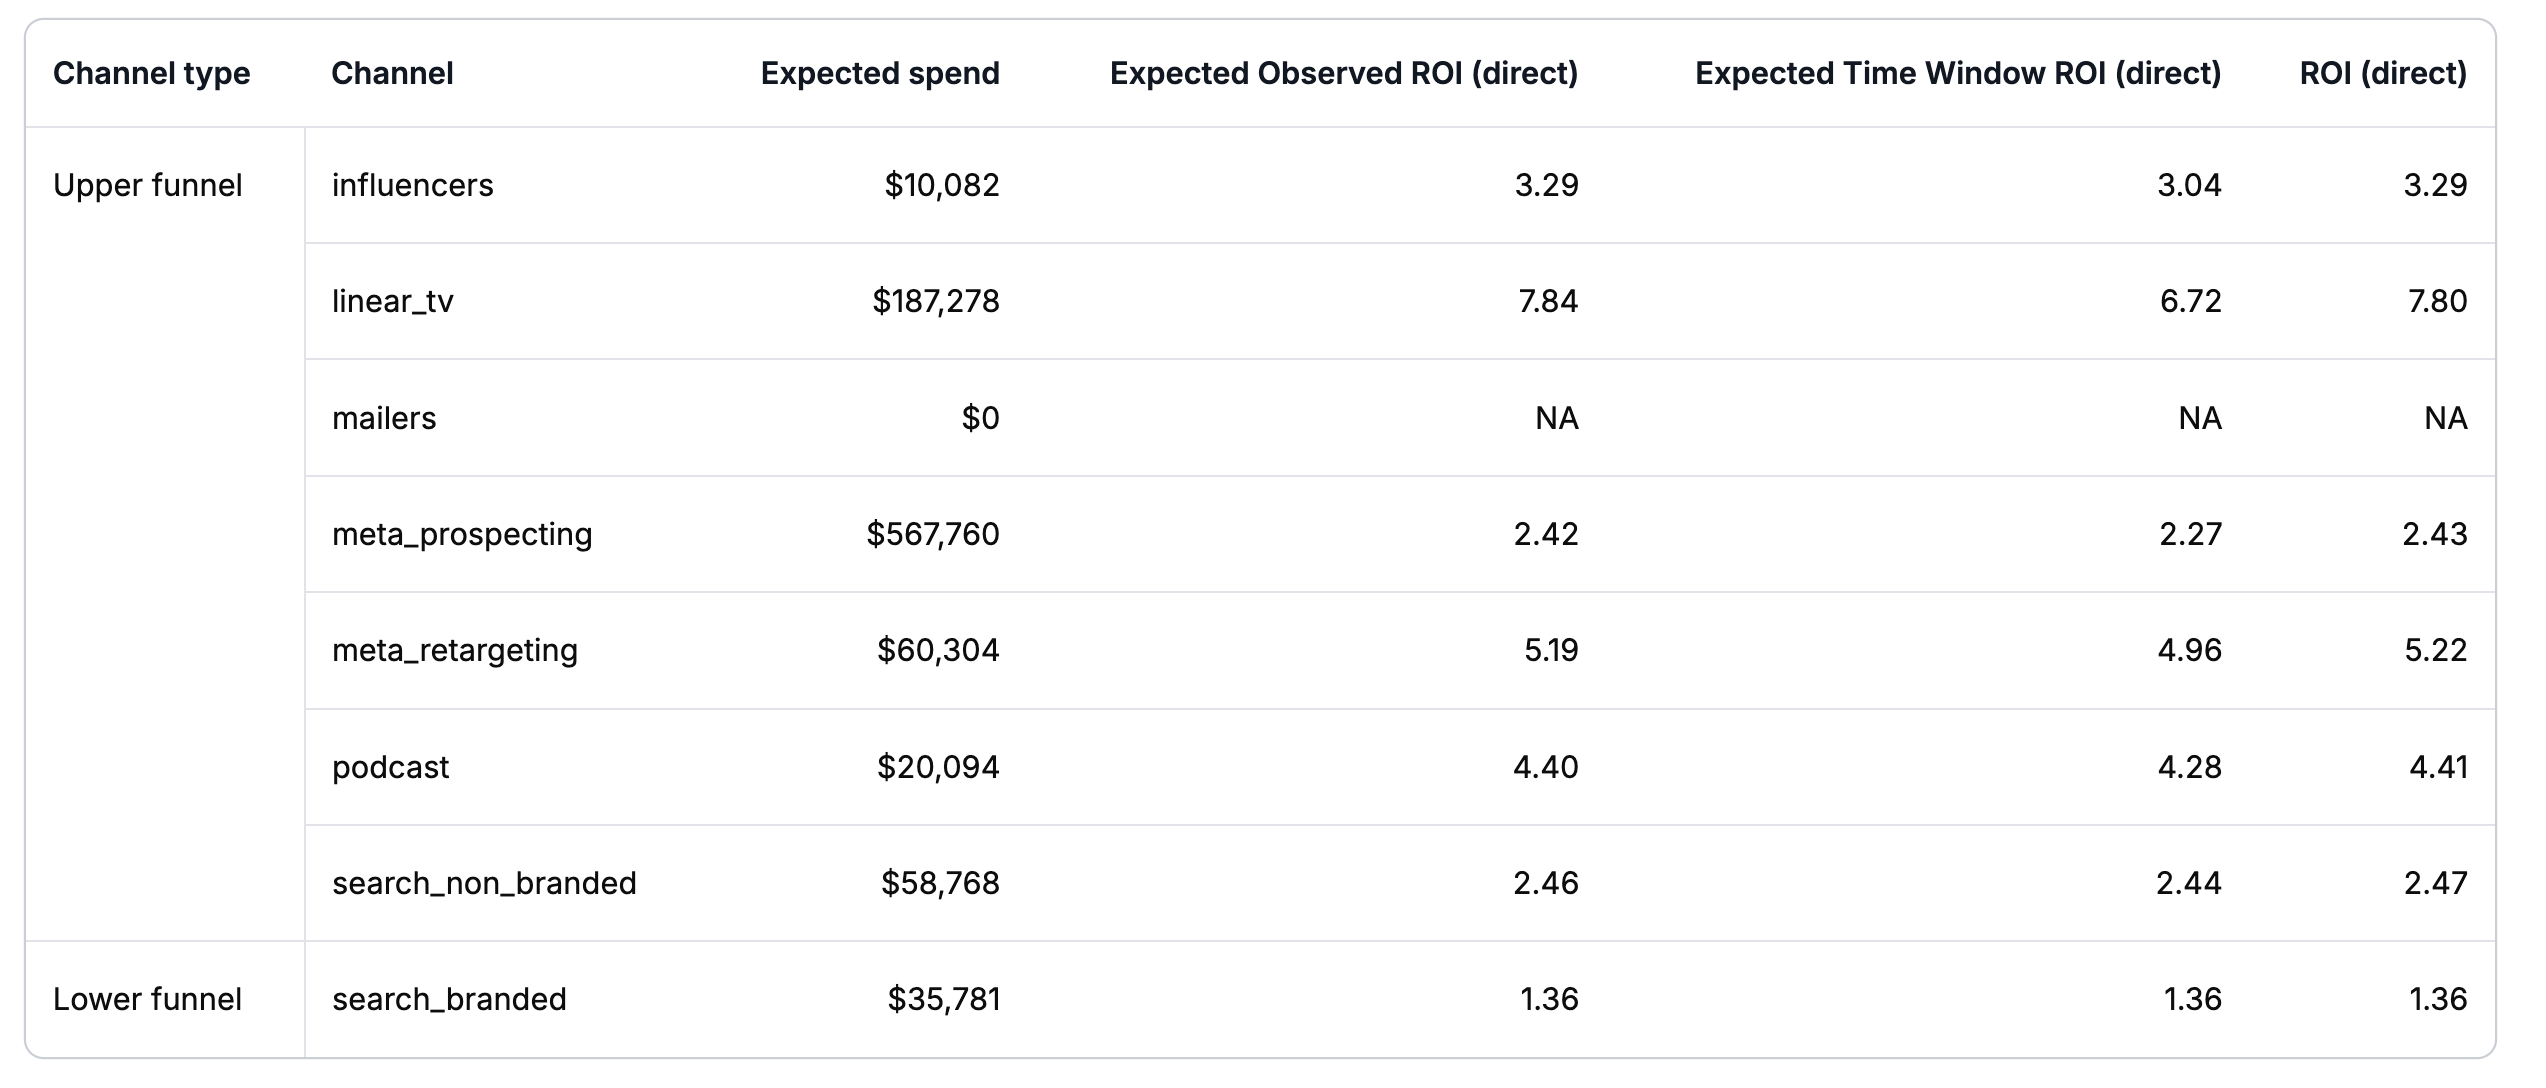
The channel summary table shows each channel, the spend, and three types of ROI estimates (defined below). The spend for upper funnel channels is what was provided in the budget. The spend for lower funnel channels depends on the setting used. If “Capped” or “Uncapped” the spend is the mean expected amount of spend that would be spent if you followed the provided upper funnel budget.
The expected observed ROI/CPA (direct) is the mean estimated revenue/conversions in the time window (impact shifted) divided by the spend in the time window. Some of the revenue/conversions will have been driven by spend in previous time periods. This calculation does not include revenue/conversions expected in the future from in-period spend.
The expected time window ROI/CPA (direct) is the mean estimated revenue/conversions in the time window (impact shifted) from spend in the time window divided by spend in the time window. It does not include shifted impact from spend that happened before the forecast period or shifted impact that is expected after the forecast period.
The ROI/CPA (direct) is the typical mean ROI estimate: impact unshifted divided by spend. It includes the impact that is expected to be observed after the end of the forecast period.
The Uncertainty Contribution
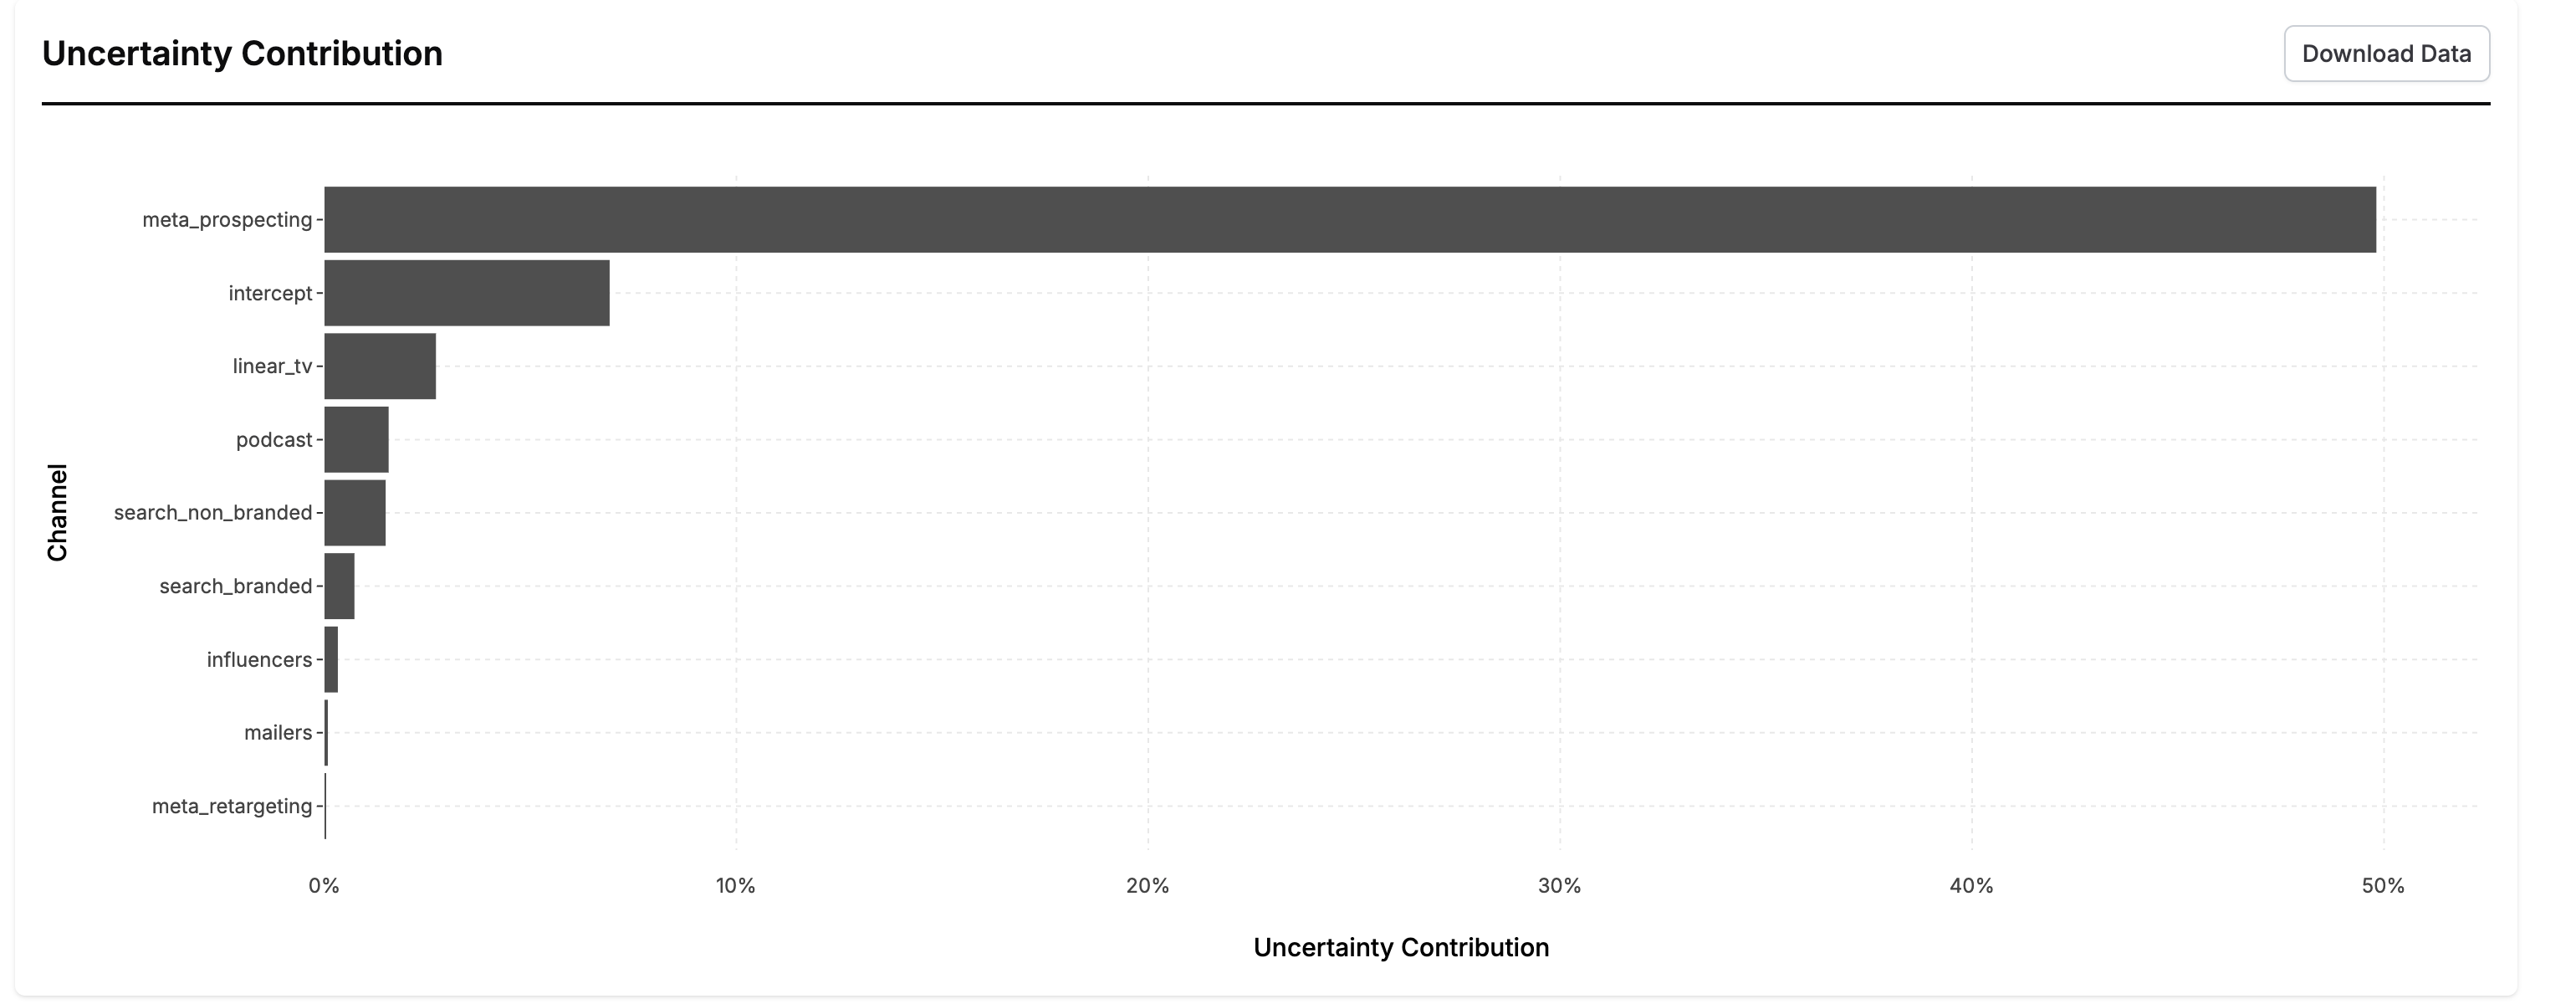
This chart is created by running a special analysis to partition the uncertainty in the forecast results to each various component of the forecast. You can interpret this chart by saying “If we knew the value of [channel] exactly, our overall uncertainty in the forecast would decrease by x%.” These numbers will add up to somewhere between 0-100%. The further these numbers are from 100%, the more inherently uncertain the forecast is (the uncertainty in the forecast is largely driven by the error term).
Channels with high uncertainty can be good candidates for incrementality tests because they show you where reducing uncertainty in a channel will most reduce uncertainty in your ability to forecast.
The Forecast Breakdown
These provide the estimates (mean, median, 25%/75%) of the impact from each part of the model (baseline, spikes, channels' shifted impact) to the total forecast at daily, weekly, and monthly intervals.
The Baseline Summary
This summarizes the baseline (non-paid) impact to the forecast at daily, weekly, and monthly intervals, with quantiles.
The Lower Funnel Spend Forecast
The lower funnel spend forecast summarizes Recast’s prediction of spend in lower-funnel channels during the forecast period. This may be useful if you selected “capped” or “uncapped” for your lower funnel settings.
Other Downloads
Paid Contribution summarizes the predicted amount of your KPI driven by all paid media spend on each day.
Daily CPA/mCPA or Daily ROI/mROI breaks down the direct ROI/CPA of spend in that channel on that day. This is unshifted, meaning that the ROI on that day will be realized in the coming weeks (as determined by the time shift).
Upper Funnel Channel Summary reports the spend, shifted impact, and the three ROIs defined in the Channel Summary Table section for each upper funnel channel over the entire forecast.
Lower Funnel Channel Summary reports the same thing as the channel summary, but with predictions for the lower funnel spend instead of exact amounts.
Spike Dates lists the spikes in the time period that were used when making the forecast.
When can a forecast start?
The Forecaster tool needs to be connected in time to your current model. If an optimizer is run or a budget plan extends into the future, input both the budget for that time period and the current planned spend.
Compare Forecasts
The forecast comparisons tool allows you to compare how different budgets lead to different outcomes.
This video demonstrates how to use forecast comparisons:
How to run a comparison
To begin your comparison, navigate to the forecaster tool and click “see past forecasts” to view a list of all the forecast you have run. You can select the forecasts to compare from this list by clicking the checkbox next to the column titled “Date run”.
Make sure all the forecasts you have selected have overlapping dates. You will be able to run the comparison only if this criteria is met. Comparisons will only be available for forecasts created after March 1st 2024. After this date, all forecasts created will be available for comparisons for 120 days.
Once your forecasts are selected, click the “compare” button at the top of the forecast list next to the title “Forecasts”. This will initiate the comparison to load.
Outputs
The results page of the forecast comparison will contain three elements:
The performance comparisons table
The performance comparison graph displays the input parameter ‘spend ‘ as well as the estimated in-period outcome in terms of revenue, the in-period efficiency and the 2.5%, 25%, 50%, 75% and 90% percentile values for the estimated outcomes of each of the selected forecasts included in the comparison.
You can use this table to see how changes in spend during the time period of your forecasts impact changes in estimated outcomes. Using this insight, you can select an appropriate spend level and set goals for your business based on the estimated outcome.
Forecast comparison graph
The forecast comparison graph is a line graph showing the estimated outcomes of each forecast for the duration of the forecasting time period.
You can use this graph to visually compare the differences in estimated outcomes for each forecast.
Budget comparison graph
The budget comparison graph brakes down how much is spent in each channel in the budgets uploaded to each of the forecasts.
Using this table, you can see how spend differences in particular channels affect the estimated outcomes of each forecast. Based on this information, you can gain an insight into how the performance of each channel drives the forecasted outcome.
💡 Recommendations
Each time you create a forecast, Recast provides you with Recommendations on how you can reallocate your daily spend to boost your forecasted outcome. You can read more about Recommendations here.
FAQ
Could we have the budget builder start historically?
Yes, given a monthly budget during the middle of the month, the budget builder figures out the future spend correctly after accounting for the actual past spend.
What if my budget has one Recast channel broken down into two more granular channels? Can I map two channels onto one?
This would require you to aggregate the two channels into the single Recast channel in your spreadsheet and re-upload your budget. Contact support@getrecast.com and we can help!
Common use-cases
Tweak a forecast and re-run it
Once you have run a forecast, you have the option of tweaking your inputted budget and re-running the forecast. This is a good option if the forecast does not match your goals or if you find that the forecast does not match your expected outcomes.
In order to tweak and rerun your forecast, navigate to the ‘past forecasts’ page and select ‘open’ next to the forecast you want to tweak. At the top of the page next to ‘upload budget’ there is a button labeled “download current”. This downloads the budget associated with the forecast you selected to your local device. Open the budget in an editor app and make the desired changes to your budget. Create a new forecast and upload the tweaked version of your budget to re-run the forecaster.
You can compare the forecasts from the initial and tweaked budgets to see the effect of your budget changes.