
The Multi-Stage Model is a survival model that estimates the conversion rates from the initial KPI to a second stage KPI further down the funnel and allows you to estimate channel performance at driving these lower funnel KPIs. This is an add on feature to the core Recast MMM. If you’d like to use this for your model, talk to your account rep or data scientist contact at Recast!
1. What Does Multi-Stage Modeling Solve?
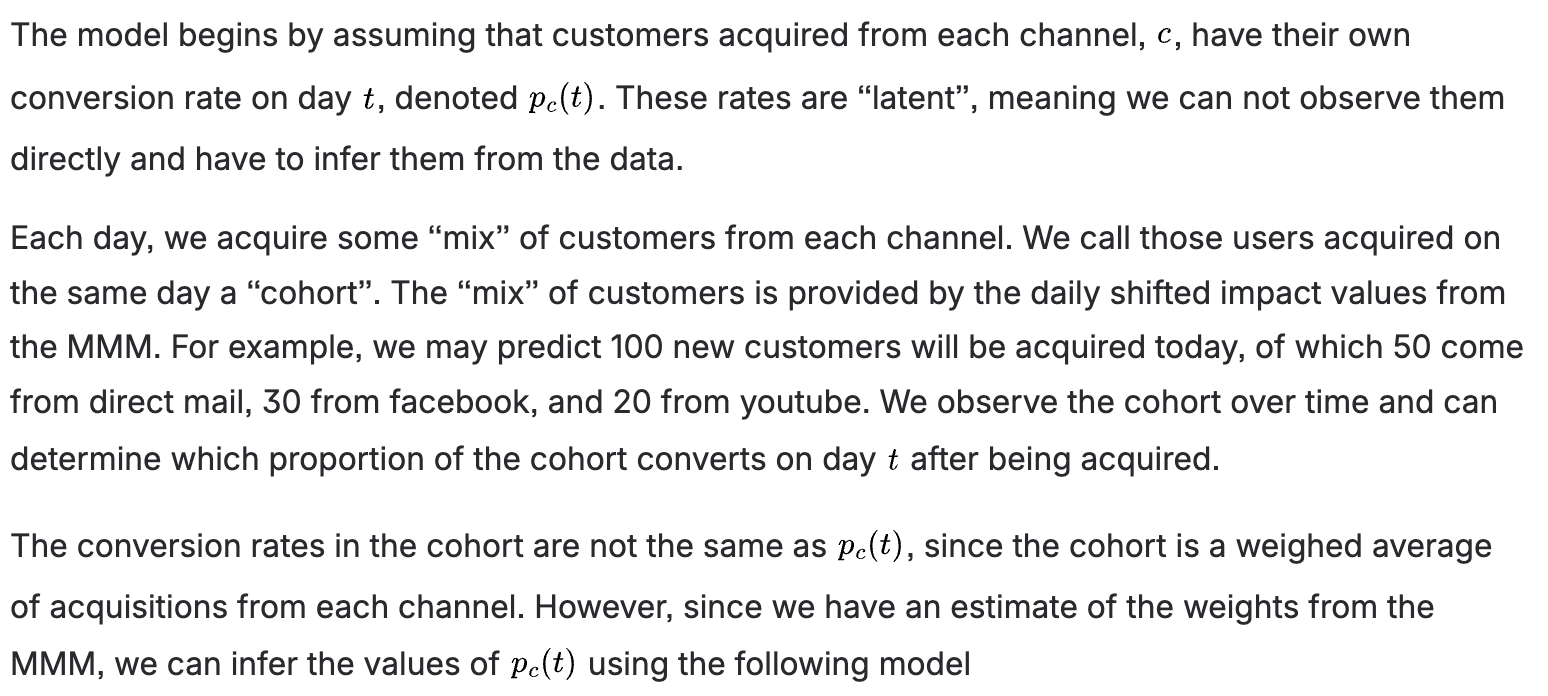
Recast MMM excels at modeling top-of-funnel acquisitions, such as “account creation” or “trial signup”, which aren't always revenue-generating. Clients may be interested in how quickly these acquisitions convert to revenue-driving actions, like funding an account or upgrading from a free-trial to purchasing the product. Multi-Stage conversion modeling addresses this by linking the first-stage conversion (e.g., “free trial start”) to a second-stage conversion (e.g., “convert to paid”).
The multi-stage functionality in Recast accounts for not only the average conversion rate between the first-stage and the second-stage, but also accounts for how different marketing channels may drive different conversion rates.
2. What Data Do We Need?
To use multi-stage modeling, Recast needs:
-
Historic data as long as the data of marketing activity used for the Recast MMM
-
The number of acquisitions made on every day
-
The number of acquisitions that convert to the second stage d days after being acquired.
Most clients will provide data in wide format, shown below. We see that on 2022-02-03, 1,303 customers were acquired in the first-stage. On day 0, 264 converted to the second stage. On day 1, 37 converted to the second stage.
|
date |
acquisitions |
d=0 |
d=1 |
d=2 |
d=3 |
d=4 |
d=5 |
d=6 |
|---|---|---|---|---|---|---|---|---|
|
2022-02-03 |
1,303 |
264.00 |
37.00 |
20.00 |
6.00 |
5.00 |
7.00 |
8.00 |
|
2023-07-11 |
1,816 |
250.00 |
39.00 |
27.00 |
16.00 |
7.00 |
6.00 |
7.00 |
|
2024-05-03 |
1,114 |
197.00 |
33.00 |
16.00 |
10.00 |
20.00 |
6.00 |
6.00 |
Clients can also provide data in long format. Either format is fine, but we will eventually be converting the data to long format when we clean the data.
|
date |
acquisitions |
time since acquisition |
new_conversions |
|---|---|---|---|
|
2022-02-03 |
1,303 |
0 |
264 |
|
2022-02-03 |
1,303 |
1 |
37 |
|
2022-02-03 |
1,303 |
2 |
20 |
|
2022-02-03 |
1,303 |
3 |
6 |
|
… |
… |
… |
… |
|
2022-07-11 |
1,816 |
0 |
250 |
Important Note on Format:
-
Confirm with the client whether the conversion data is cumulative or daily. It's preferable to receive daily conversion counts rather than cumulative totals. If the client can only provide cumulative counts, we need to do some extra data munging to get daily counts.
-
Ensure missing values are not replaced with 0s. If conversions for a future date haven't been observed yet, they should be marked as NULL/NA, not 0.
-
For example, if on September 1, 2024, you acquire 1,000 new customers:
-
By September 3, you prepare the data for multistage conversion.
-
On day 0, 100 of the 1,000 users converted to the second stage. On day 1, 50 converted.
-
Since you haven’t observed conversions for days 2, 3, etc., these should be recorded as NA, not 0.
-
-
-
As a corollary to the above, ensure 0s are genuine counts and not placeholders.
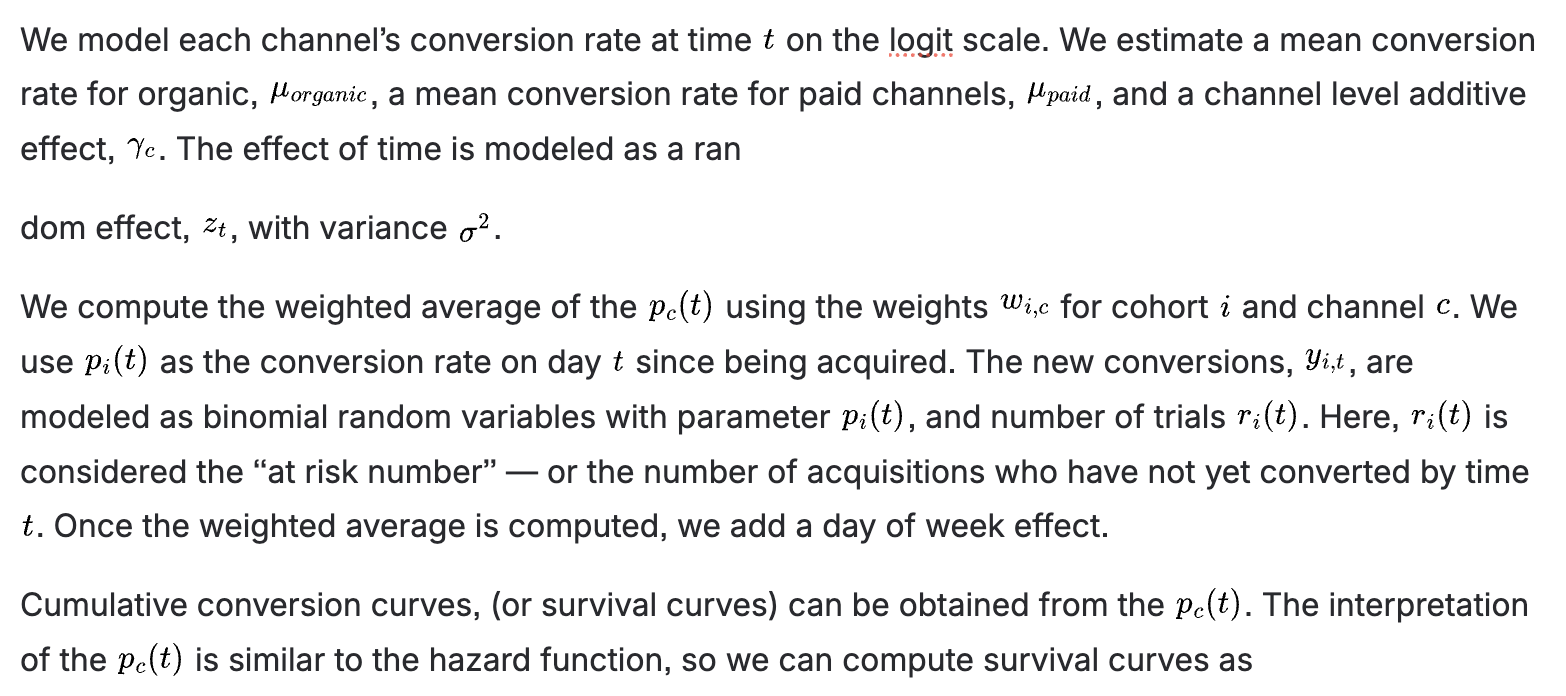
3. The Model
Model Details


4. Including Multi-Stage Models in the Dashboard
We can include multi-stage models natively in the Recast dashboard (and planning tools like Goals, the Forecaster, and the Optimizer) by making a few transformations to the data of the primary model.
These transformations are relatively simple; we need to transform the following variables:
-
The spend-response curves for each channel (as well as their resulting CPAs, mCPAs, and Impacts)
-
The baseline
-
The spikes
With the following adjustments:
-
Multiplying each of the above variables by their cumulative conversion rate (or divide, as the case may be). For example, if a channel has a $100 CPA for a “Sign Up” endpoint, and 50% eventually convert to a “Paid Upgrade”, then this channel will have a $200 CPA for the “Paid Upgrade” endpoint.
-
Convolve the shifted-impacts of each variable by the daily conversion rates


With these transformations of the variables in the primary model, the underlying data can be published as if it were a normal Recast model with all of the main features available. Certain sections of the dashboard, such as Backtests, Prior vs. Posterior, and Experiments, will not be available since they will only apply to the primary model.