This guide provides an overview of the key factors within Recast's model that influence the optimizer's selection of a budget.
These include:
-
How the model estimates outcomes based on past performance and seasonality
-
The role of uncertainty
-
Particularly, the importance of diversification in managing risk across channels
-
-
The interaction between upper and lower funnel drivers
Together, these factors offer an explanation of the modeling methods that guide the optimizer’s budget selection process.
Summary of How does the optimizer allocate spend?
The optimizer selects its optimal recommendations by gradually making small tweaks to a budget and measuring the range of expected KPI based on 500 samples or draws from the model.
The draws come from a distribution of possible model parameters. These parameters include channel effect, saturation and intercept.
The distribution of the model’s estimates determine the range of possible outcomes for each budget explored by the optimizer.
💡The guide: How does the optimizer allocate spend? has more details about how the optimizer works. Reading this guide before delving into why the optimizer is recommending a budget could help clarify your understanding.
Past Performance
The model incorporates certain assumptions about past performance when estimating future channel effect:
-
Each day is like the day before it.
-
Each day is like the same day one year ago.
In doing this, the model takes into account the seasonality of your channel performance. This could be driving your predicted channel estimates and the optimizer’s recommendations.
How to Check:
You can look at the historical seasonal trends that the optimizer is predicting seasonality based a few different ways.
To account for the seasonal performance in historical data:
-
Navigate to the Channel Performance tab in the Insights dashboard.
-
Select the channel of interest.
-
The ROI graph is the first graph on the page
-
Highlight a section of the graph to zoom in.
-
Look for changes in the ROI over time to identify seasonal patterns.
To control for saturation and isolate seasonal impact in predicted performance:
-
Navigate to the Fixed Spend report
-
Select all the channel to include in your analysis
-
Select how far back you would like to go in your analysis using the start date
-
The end date defaults to 730 days into the future
-
Input the spend level at which you would like to view impact over time
-
Look at how the line graph indicates impact over time. This shows the seasonal changes in impact of your channel(s) at the selected spend level.
To look at the predicted seasonal trends in the optimizer recommended budget:
-
Download the “Daily ROI with Quantiles” file from the optimizer outputs.
-
Upload the file to google sheets or excel [Example].
-
Insert a line graph.
-
Highlight the date range of the planning period in the ‘id’ column as the range of data for the x-axis
-
Highlight the cells in ‘direct ROI’ column corresponding to the channel in question as the range of data for the y-axis.
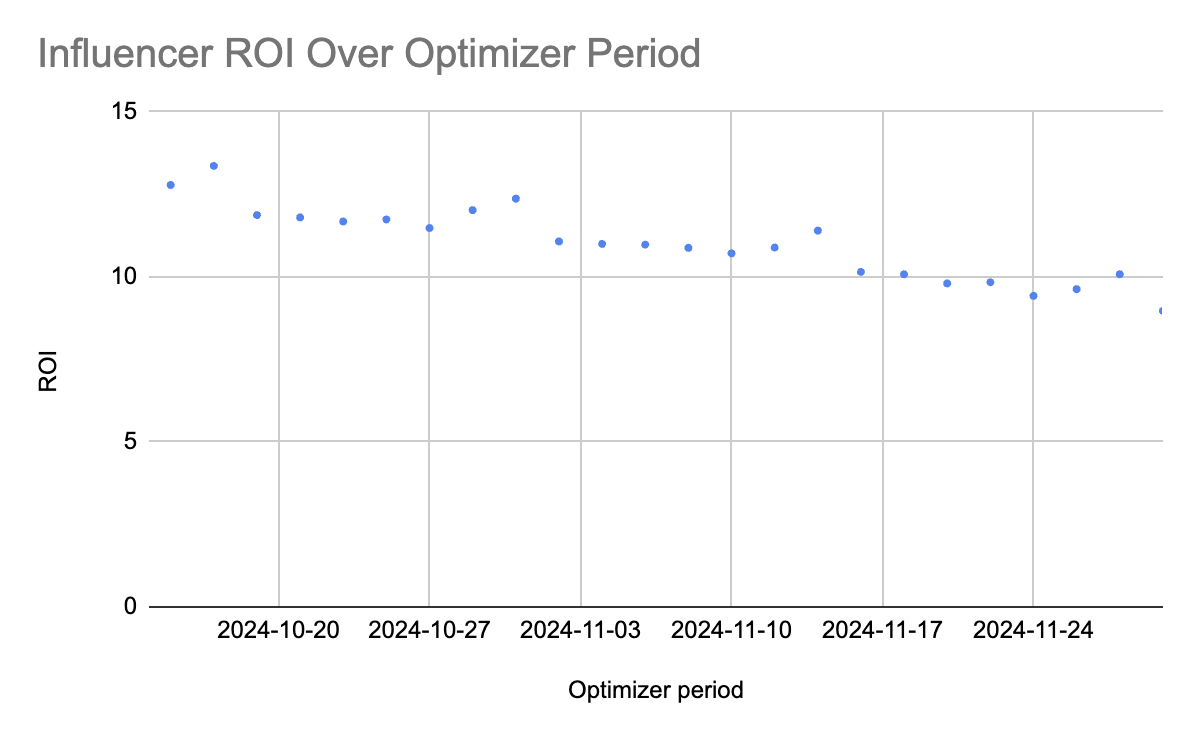
This should give you a chart of the expected ROI over the planning period for the channel of interest. See if you can find any pattens in the ROI over time. These are the seasonal variations that we are modeling when predicting KPI outcome for a certain budget.

You might notice that your optimizer is recommending that you spend more in a channel with a lower ROI compared with a channel with a higher ROI. Next we will explore how uncertainty plays a role in the optimizer’s recommendations and how this could be why you are seeing these results.
Uncertainty
Recast’s optimizer inherently takes into account the uncertainty present in the model’s estimates. It does this by looking at the range outcomes given all 500 draws for each possible budget. This is to offset the risk of correlated channel estimates.
Some channels are highly correlated so the model estimates that spending in both correlated channels leads to a lower probability of meeting your target. You can think of correlated channels as “high risk” channels. We are trying to maximize the probability we reach the overall goal with the overall mix. You want to spread your risk so that you have sufficient confidence in reaching your goal but are also maximizing the outcome. You can get a sense for the ‘risk’ by looking at how wide your uncertainty interval is.
There are many different reasons why your channels could be uncertain:
-
Changing spend in multiple channels at the same time - If you change spend in the same direction (increasing or decreasing) at the same time, this leads to correlated channels. The model has a hard time differentiating which one of the correlated channels drove which KPI units.
-
Spend in a channel only during promotions- the model may have high uncertainty as it can not tell what the saturation of the channel would be during business as usual.
-
Constant spend levels - If you have not changed spend in your channel for the duration of data in the model, the model will have a hard time knowing how the channel will react if spend changed.
-
Low spend - If you have historically low spend in a certain channel, the model might not have enough signal to determine the channel estimates with certainty.
How to Check:
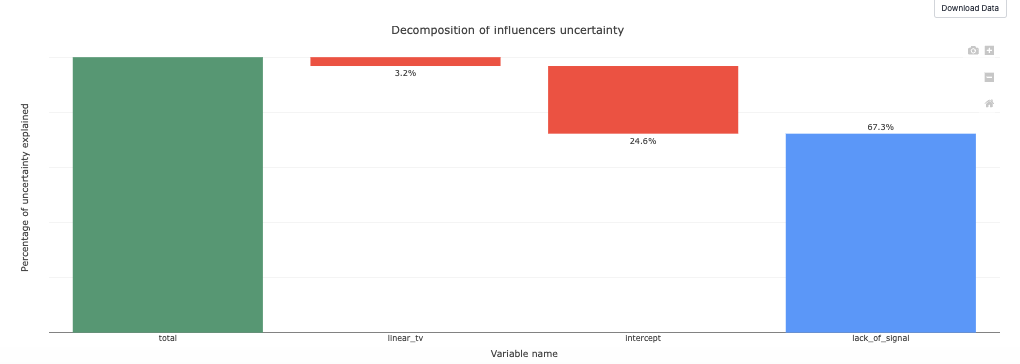
You can use the Variance Decomposition report to find where the uncertainty in your channel is coming from.
-
Navigate to the Reporter in the Recast dashboard and select ‘Variance Decomposition’.
-
Select the timeframe you are interested in investigating and run the report
-
Select the channel and scroll down to the waterfall chart at the bottom of the page.
This shows us where the uncertainty in this channel is coming from.

-
Here you can see that ~3% is coming from a correlation with linear TV. This could mean that you have historically increased and decreased spend in these two channels at the same time. You could plan a period where you go dark in one of these channels and spend up in the other to pull apart the correlation between the two.
-
It also shows that the majority of uncertainty is coming from a lack of signal. This could mean that you have historically low spend in this channel. This is a good opportunity for a spend up test in this channel.
-
Additionally, it shows that ~24% of the uncertainty is coming from a correlation with the intercept. This could be because you are spending more in this channel during periods when your business is growing. This might be a good opportunity for a go dark test in this channel.
To see the uncertainty around each of the channels in your optimization, download the “Daily Outcome with Quantiles” file from your optimizer output. The range between your ‘contribution 25%’ and your ‘contribution 75%’ shows the 50% confidence interval for each channel.
But hold on.. you might notice that the optimizer is recommending that you spend more in a channel that is more uncertain. This is because there are several other factors that determine the probable predicted outcome of a budget.
Diversification
The uncertainty in Channel A is not necessarily randomly distributed with regard to the uncertainty in Channel B.
This means there could be situations where the model believes that if Channel A is effective, Channel B is not effective or vice versa. Due to this negative correlation, the probable outcome of spending in both these channels together could result in a narrower uncertainty interval compared to spending in unrelated channels.
This could occur even if the uncertainty interval of Channel B when considered independently of Channel A is wider than that of Channel C when considered independently of Channel A. In such cases, the 25th percentile (conservative) of the distribution of draws for a budget spending in Channel A and B could still be higher than the 25th percentile for a budget where spend is allocated to Channel A and Channel C, which may have no significant relationship with Channel A.
You can look at a Variance Decomposition to get a general idea of which channels drive uncertainty in Channel A. We might expect to see Channel B having a notable impact on Channel A uncertainty if this is the case, however this report does not look at whether the correlation between channels is positive or negative.
Lower Funnel Drivers
Recast also factors in the KPI outcome of your lower funnel channels when modeling the probable outcome of your budget.
If a budget spends in an upper funnel channel that drives spend to a lower funnel channel which in turn increases the outcome of the objective function, the optimizer will prefer this budget. Both the volume the upper funnel channel drives to the lower funnel as well as the efficiency of the particular lower funnel channels that receive spend from each upper funnel channel are factored in to the modeled outcome of a certain budget.
You might see an upper funnel channel that has a slightly lower ROI allocated more spend than another upper funnel channel with a higher ROI. You might also see a channel that is more uncertain get allocated a higher spend. This could be because they are efficient drivers of lower funnel spend.
How to Check:
To understand why this might be the case, you can use Recast’s Lower Funnel Spend page.
-
Navigate to the Lower Funnel Spend page Insights dashboard.
-
Click on the lower funnel channel tab. If you have multiple lower funnel channels, click on the lower funnel channel with the highest efficiency in the output of you optimizer.
-
Using the waterfall chart and the table, find the upper funnel channel you are investigating and look at the spend driven. Compare this value to the spend driven by other channels.
-
If the spend driven is higher, this could be an indication that the upper funnel channel in question is driving a high volume of spend to your lower funnel channel that could be very effective. This might be why the optimizer is allocating a sizable spend into this upper funnel channel.
-
To check whether the optimizer is recommending a budget based on spend driven to the lower funnel, you can re-run the optimizer with the lower funnel channels turned off. Look for any large differences in spend allocation to your upper funnel channels. If an upper funnel channel is now being allocated significantly less spend, this is an indication that the budget may be selected because of the rate at which certain upper funnel channels are predicted to drive spend into your lower funnel.
Even if your lower funnel is less efficient than other channels, you could be driving enough volume to benefit your objective leading to the optimizer selecting a particular budget.
Conclusion
In all, the predicted outcome of the optimizer depends on the distribution of the model’s estimated outcomes and the correlation between the model’s estimates. When recommending a budget, the optimizer:
-
Explores multiple budgets and calculates the result of the objective function(s) determined by what you are optimizing for.
-
Makes incremental changes to this budget and calculates the result of the objective function.
-
Finds a budget that maximizes the objective function(s) at the percentile determined by the selected confidence level.
In doing so, the optimizer applies all the model’s estimates to maximize the expected outcome of the recommended budget with the required amount of confidence.