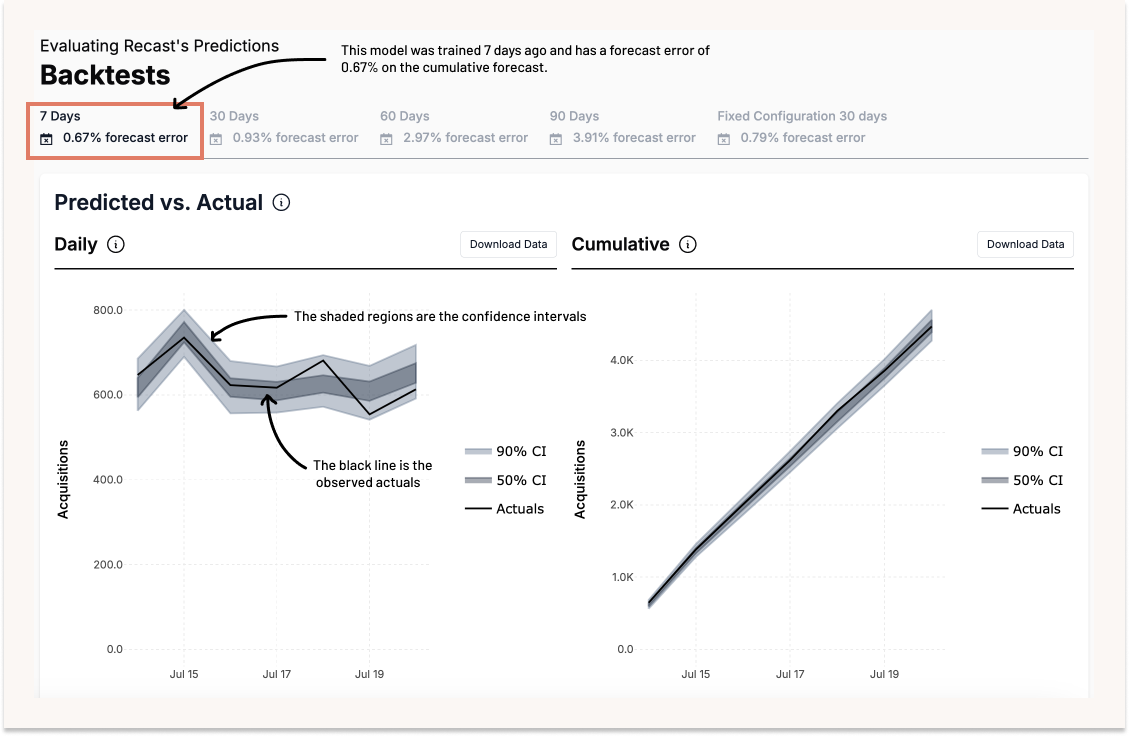
The backtests tab is probably the most important tab in the entire Recast platform. The backtests tab helps us understand how well your Recast model does at predicting the future on data the model has never seen before. We believe this is the most important way to evaluate the accuracy of an MMM model.
The way the Recast backtests tab works is that it shows you how well models trained on data in the past do at predicting the future. So if we trained a model 60 days ago, how well does that model do at predicting the next 60 days (data that we now have, but that the model never saw).
The tabs at the top of the backtests page show backtests of different lengths and the corresponding forecast errors. The errors rates are the CRPS Continuous Ranked Probability Score which evaluates the full predictive density of a model.

At Recast we run backtests of varying lengths to show how models trained on data at various points in the past are at predicting the time period spanning when the model was trained to the most recent date of data on the model. Due to the inherently volatility of marketing, backtests with a longer forecast length tend to have a higher forecasting error.
The fixed configuration backtests is a unique case of the 30 day backtest. Recast often makes tweaks to your models to keep our understanding of spikes, and other model configuration details up to date. The fixed configuration backtest makes sure that configuration is constant between the current model and the model used in the backtest. This means we fit the same model twice. Once leaving the last 30 days of data out, and one with the complete set of data. In comparing these we get an insight into the most fair backtest comparison.
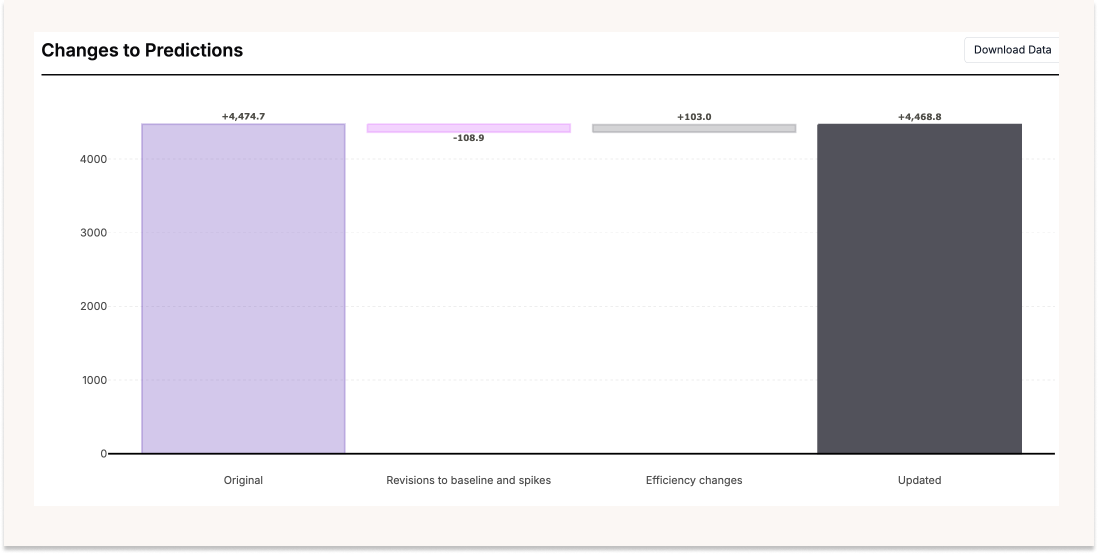
Changes to prediction
The changes to prediction graph decomposes where the differences between the two models come from. Specifically it shows us how much of the different can be attributed to changes in spikes and the baseline vs. how much can be attributed to efficiency changes. This can help you identify where and why you are seeing changes in your model.

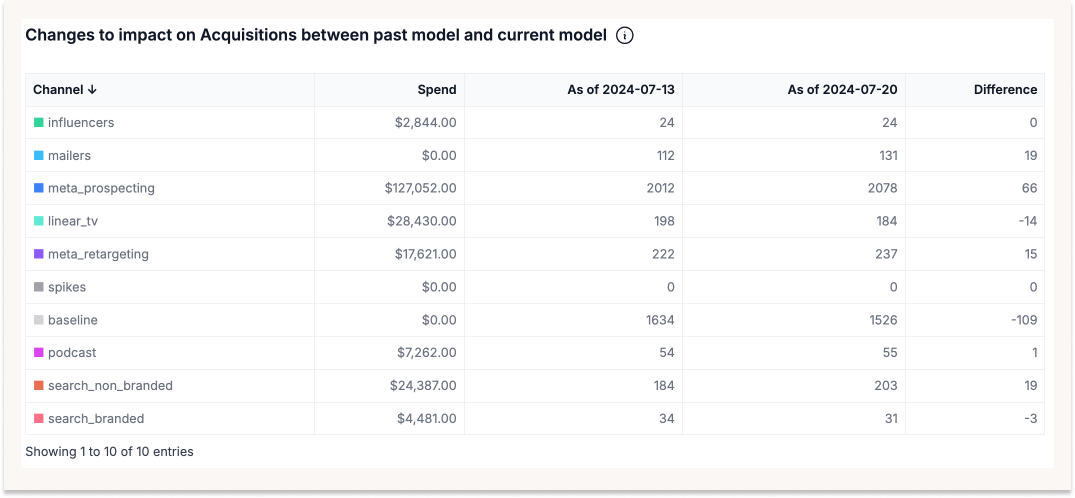
Changes to impact
The changes to impact table further breaks down how much the Recast's estimate of the impact driven by each channel changed between models. The difference column shows the magnitude and direction of this change in each channel.
