
The “intercept” shows you your brand’s “baseline” sales. That is, how many sales would you have in the absence of any marketing activity (or at least the marketing activity included in your Recast model). You can view the intercept on its own or you can view the intercept combined with the “spikes” (holidays, promo events, etc) all in one chart.
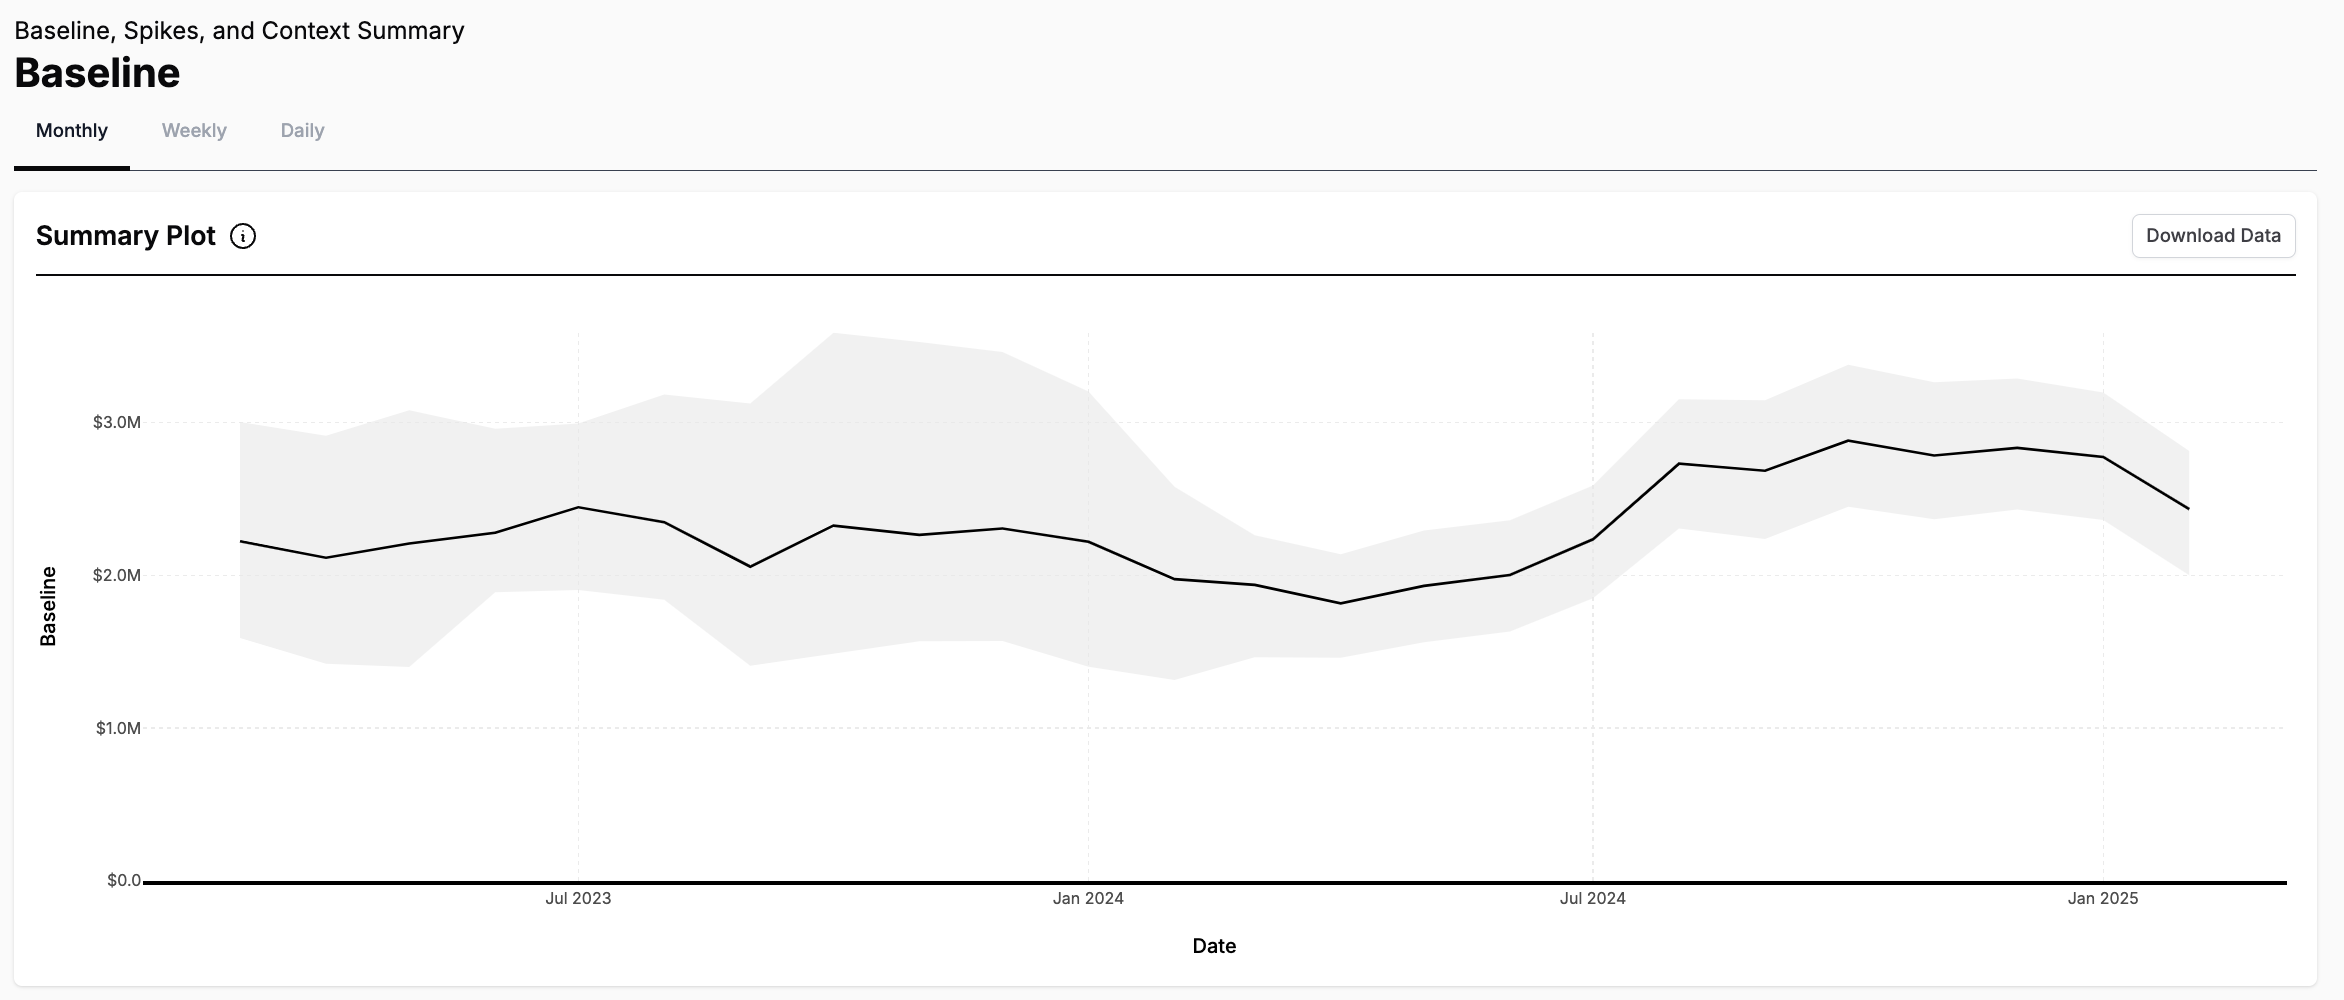
How to interpret your intercept plots?