
The Context Summary is a useful tool for companies who have models with additional factors affecting their marketing outcomes. For example, if you find that after a price change or new offer, your sales are performing differently, our model will be able to measure these changes.
You can use these graphs for answer questions like:
-
What is the impact of brand awareness on my marketing effectiveness?
-
We are planning to increase the price of our offering. How is this expected to impact my marketing effectiveness?
The context summary shows the range of estimated effect of your context variable on your marketing effectiveness.
Contextual metrics must be pre-configured in your Recast model before the report will be available
Interpreting the Graphs
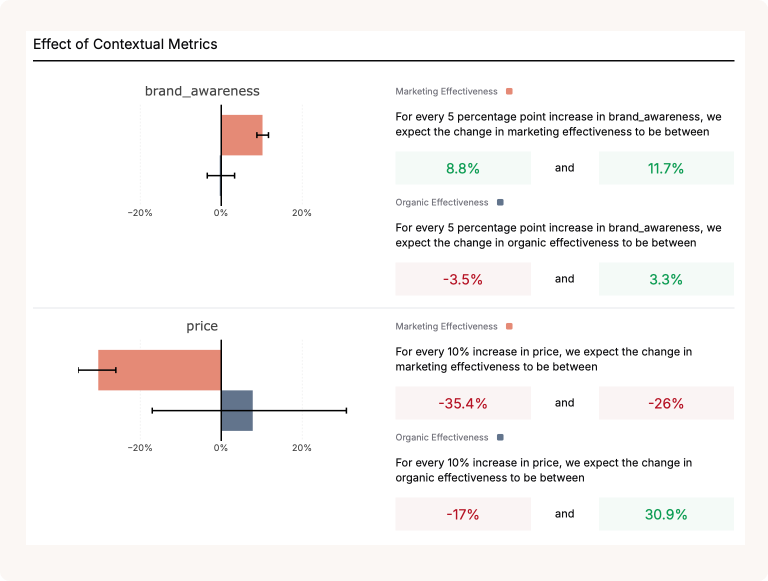
Effect of Contextual Metrics
The first graph in this report is the Effect of Contextual Metrics graph. For each of your contextual metrics, this tells you how much your marketing effectiveness will change with a change in your context variables.
For example, the graph below tells us that a 5 point increase in brand awareness is expected to lead to an increase in marketing effectiveness between 8.8%-11.7%.
For each contextual metric, you can see the impact of changes on both the paid and baseline effectiveness.
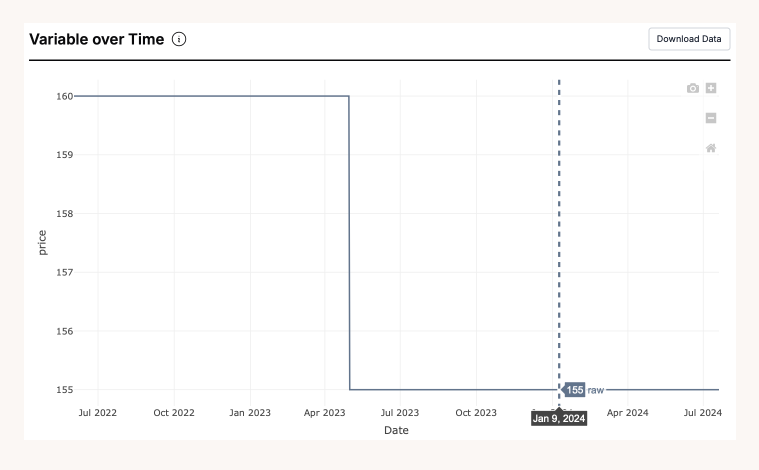
Variable Over Time
The next graph is the variable over time graph. This tells us how much your contextual metric has changed over time. In the graph below, we can see that the price decreased in May 2023 from $160 to $155. You can use this information to provide context to any changes you see during this time in your marketing effectiveness.
Use the hoverover to find the value of your context variable on a specific date.
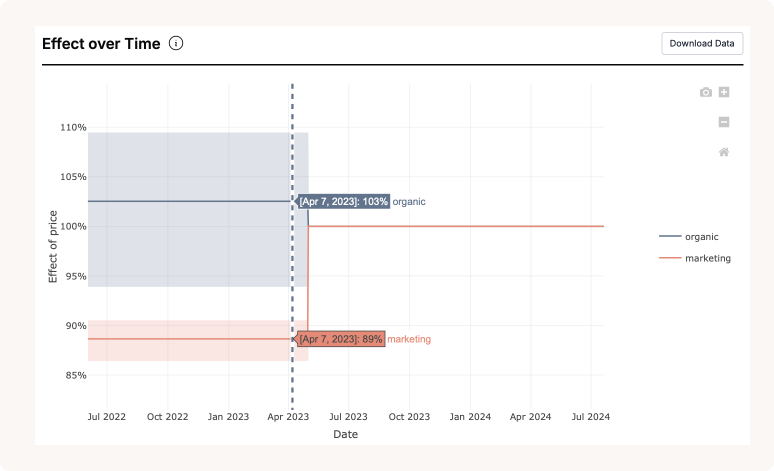
Effect Over Time
The final graph is the effect over time graph. This shows us the effect of the contextual metric on marketing effectiveness over time.
In the graph below you can see that when there was a price change in May 2023, the organic effectiveness fell from 103% to 100%.
To use the two graphs together:
-
Identify the time period when there was a change in the contextual metric using the first graph.
-
Look at the same time period in the second graph to see the the effect of the change on marketing effectiveness.
How to interpret the Context Summary?