
Each Plan has a dedicated Goals tab where you can set targets and see how your spend plan is expected to deliver against those targets.
❓ What Goals are used for
-
Track progress against your targets (current and future)
-
Understand the probability of achieving your target given your current Plan
-
See how changes to your Plan or model affect your probability of success over time
-
Receive tailored reallocation suggestions based on where your model sees the most opportunity
💁 How to create a Goal
Goals are created from within a Plan. Navigate to the Plan you want to track, then select the Goals tab from the Plan sidebar. Click Add Goal and complete the following steps.
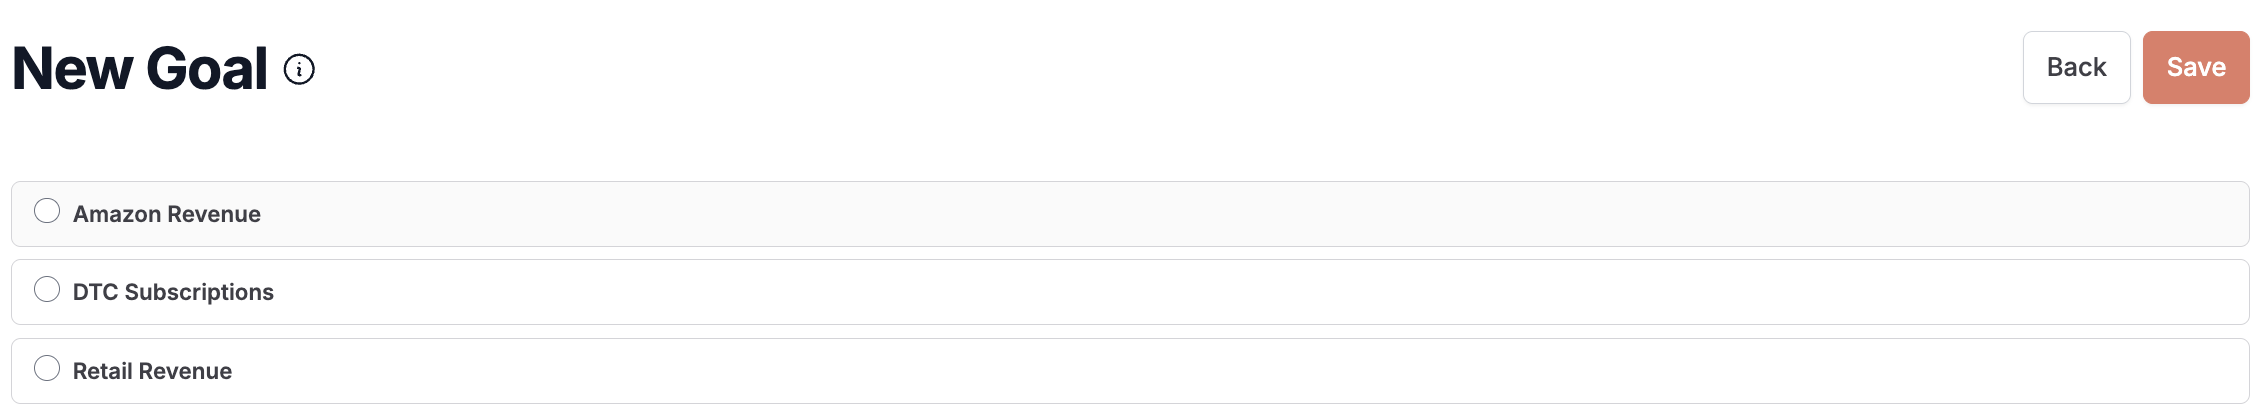
Step 1: Select a KPI
Choose the KPI you want to track. The KPI selector is filtered to only show KPIs that are compatible with the Plan, so your Goal will always be aligned with your Plan's configuration.
Note: Goals cannot be created on custom KPIs you have built yourself until KPI editing functionality is available. If you need to track a custom KPI, contact your CSM.
Step 2: Set Goal Parameters
Input the following fields to specify the Goal you want to track:
-
Goal Name
-
Date Range — must fall within the Plan period. Goals can be set on any sub-period of the Plan, including periods as short as a single day.
-
KPI target value (e.g. $20M revenue; 50k units; 15k new subscribers)
Recast pulls the budget and lower funnel channel settings for your Goal directly from your Plan. No separate uploads are needed.
Setting Goals that start in the future:
You can set a Goal that starts in the future to see how you are forecasted to perform against your target before the Goal period begins. Recast uses the Plan budget to generate a forecast, and where the Plan does not yet have budget data between the model date and the Goal start date, the Default Plan with the Recast predicted budget is used to fill in the gap. As long as your Plan covers the Goal period, you will be able to see your expected performance, probability of reaching your Goal, and automatic recommendations for spend changes that will help you optimize your budget.
📋 Managing Goals within a Plan
Multiple Goals: A Plan can have multiple Goals. Goals can cover any length of time between one day and the full Plan period, and they can have overlapping date ranges.
Editing a Goal: You can update a Goal's target value and date period (within the Plan period) at any time. The KPI cannot be changed once the Goal is saved, and the budget cannot be edited directly on the Goal since it is always sourced from the Plan.
Past Goals: Goals whose end date has passed are non-editable. You can still view them and their realized outcomes.
Deleting a Goal: To delete a Goal, open the Goals tab in Plans and confirm the deletion when prompted. This action cannot be undone.
🔄 Compatibility and model changes
If your model configuration changes, you do not need to recreate your Goals. Use the Plan compatibility tools to update your Plan's compatibility with the new model configuration. Once compatibility is restored, your Goals will refresh automatically and continue tracking against your targets.
If a Goal's KPI becomes incompatible with the Plan, a warning indicator will appear on the Goals tab. You will see the message: "The Goal KPI is not compatible with any KPIs associated with this Plan. Please fix the compatibility to view the Goal." No forecast will be run for that Goal until compatibility is resolved.
Note: Goals cannot be created on custom KPIs. If a migrated legacy Goal used a KPI configuration that does not match any existing KPI in your Plan, it will display the compatibility warning above. Contact your CSM or reach out to support@getrecast.com for help resolving this.
🗓️ When Goals are updated
Goals, including forecasts, probability of hitting your Goal, and recommendations, are updated automatically every time your Plan, model, or KPIs update.
📤 Goal Outputs
Probability of hitting your Goal
The Goals tab provides a probabilistic estimate of whether you will hit your target, along with a visual reference for how you are tracking toward it. This is calculated based on a projection of your spend and ROI/CPA across all channels in your Plan.
60% probability does not mean you will hit 60% of your Goal. It means you are 60% likely to meet 100% of your Goal.
Details
This table shows values for spend, your dependent variable, and marketing performance. The values shown are:
-
"So far" — for the period where actual data is available
-
"Forecasted" — for the period being forecasted by the model between the last modeled date and the end of the Goal period
-
"Projected" — a combination of the "so far" and "forecasted" values
Expected performance against Plan
This plot shows your Goal as a straight line to your target value over the Goal period. Actual performance is plotted between the Goal's start date and the last modeled date. Forecasted performance, along with its associated uncertainty interval, is plotted from the last modeled date forward to the Goal's end date.
Forecast history
Every time your Plan or model updates, Recast creates a new forecast against your Goal and records the probability of hitting your target in the Forecast History. Open the forecast history for any Goal to see how your probability of success has shifted over time, and which Plan version each forecast was run with.
The forecast history only shows forecasts run after the Goal was created and before the Goal period ended. Forecasts run prior to Goal creation or after the Goal end date are excluded.
This allows you to compare how a specific budget update or model refresh moved the needle on your Goal, without needing to create a new Goal each time.
💡 Recommendations
Every time the Goal forecast updates, Recast generates new Recommendations for ways you can shift budgets to more effectively hit your Goals. When you are viewing a Goal, the Recommendations shown are specifically aimed at maximizing your KPI within the remaining Goal period.
You can read more about Recommendations here.
📦 Migration from the standalone Goals tab
All current and future Goals have been automatically migrated into Plans. Recast has created a Plan for each of your existing Goals and moved them into the Goals tab of that Plan. Automatically created Plans are named after the Goal they were created from.
During the transition period, the standalone Goals tab remains available in read-only mode so you can still reference past Goals. It will be removed on May 11th.