
The Single Channel pages are an opportunity for you to deep dive into the historical performance of each of your channels individually. This page consists of a historical overview, a saturation plot, historical efficiency, marginal efficiency, impact and impact shifted plots, along with a channel level time shift plot.
The “Include lower funnel effect” toggle switches the entire page to show total effects from the default direct effects.
The date selector applies to the historical overview and the saturation plot and offers the option to select 7 days, 30 days and 90 days.
Overview
In the Overview banner you will see high-level metrics summarizing the channel over the selected period. You will also be able to see the change in each of the reported metrics comparing this period to last period, and this period to the same time last year.

The metrics are:
-
Spend - This is the actual spend in the selected channel during the time period.
-
Impact - This is the direct impact realized in-period in the selected channel.
-
Efficiency - This is the expected efficiency of your spend during the time period.
-
Marginal Efficiency - This is the expected marginal efficiency of your spend during the time period.
Channel Saturation
The channel saturation plot shows the expected return at various levels of spend over a given number of days. The number of days is configurable using the dropdown in the top right.
The points to evaluate on the saturation curve are chosen using your recent spend history. For example, if you selected to spread your spend over 7 days and spent $100,000 in the previous 7 days, the spend response will be evaluated at $100,000 and proportions of this value (.1, .25, .5, .75, 1.25, 1.5, 2). The highlighted point on the plot shows the predicted impact at your actual spend during the time period.
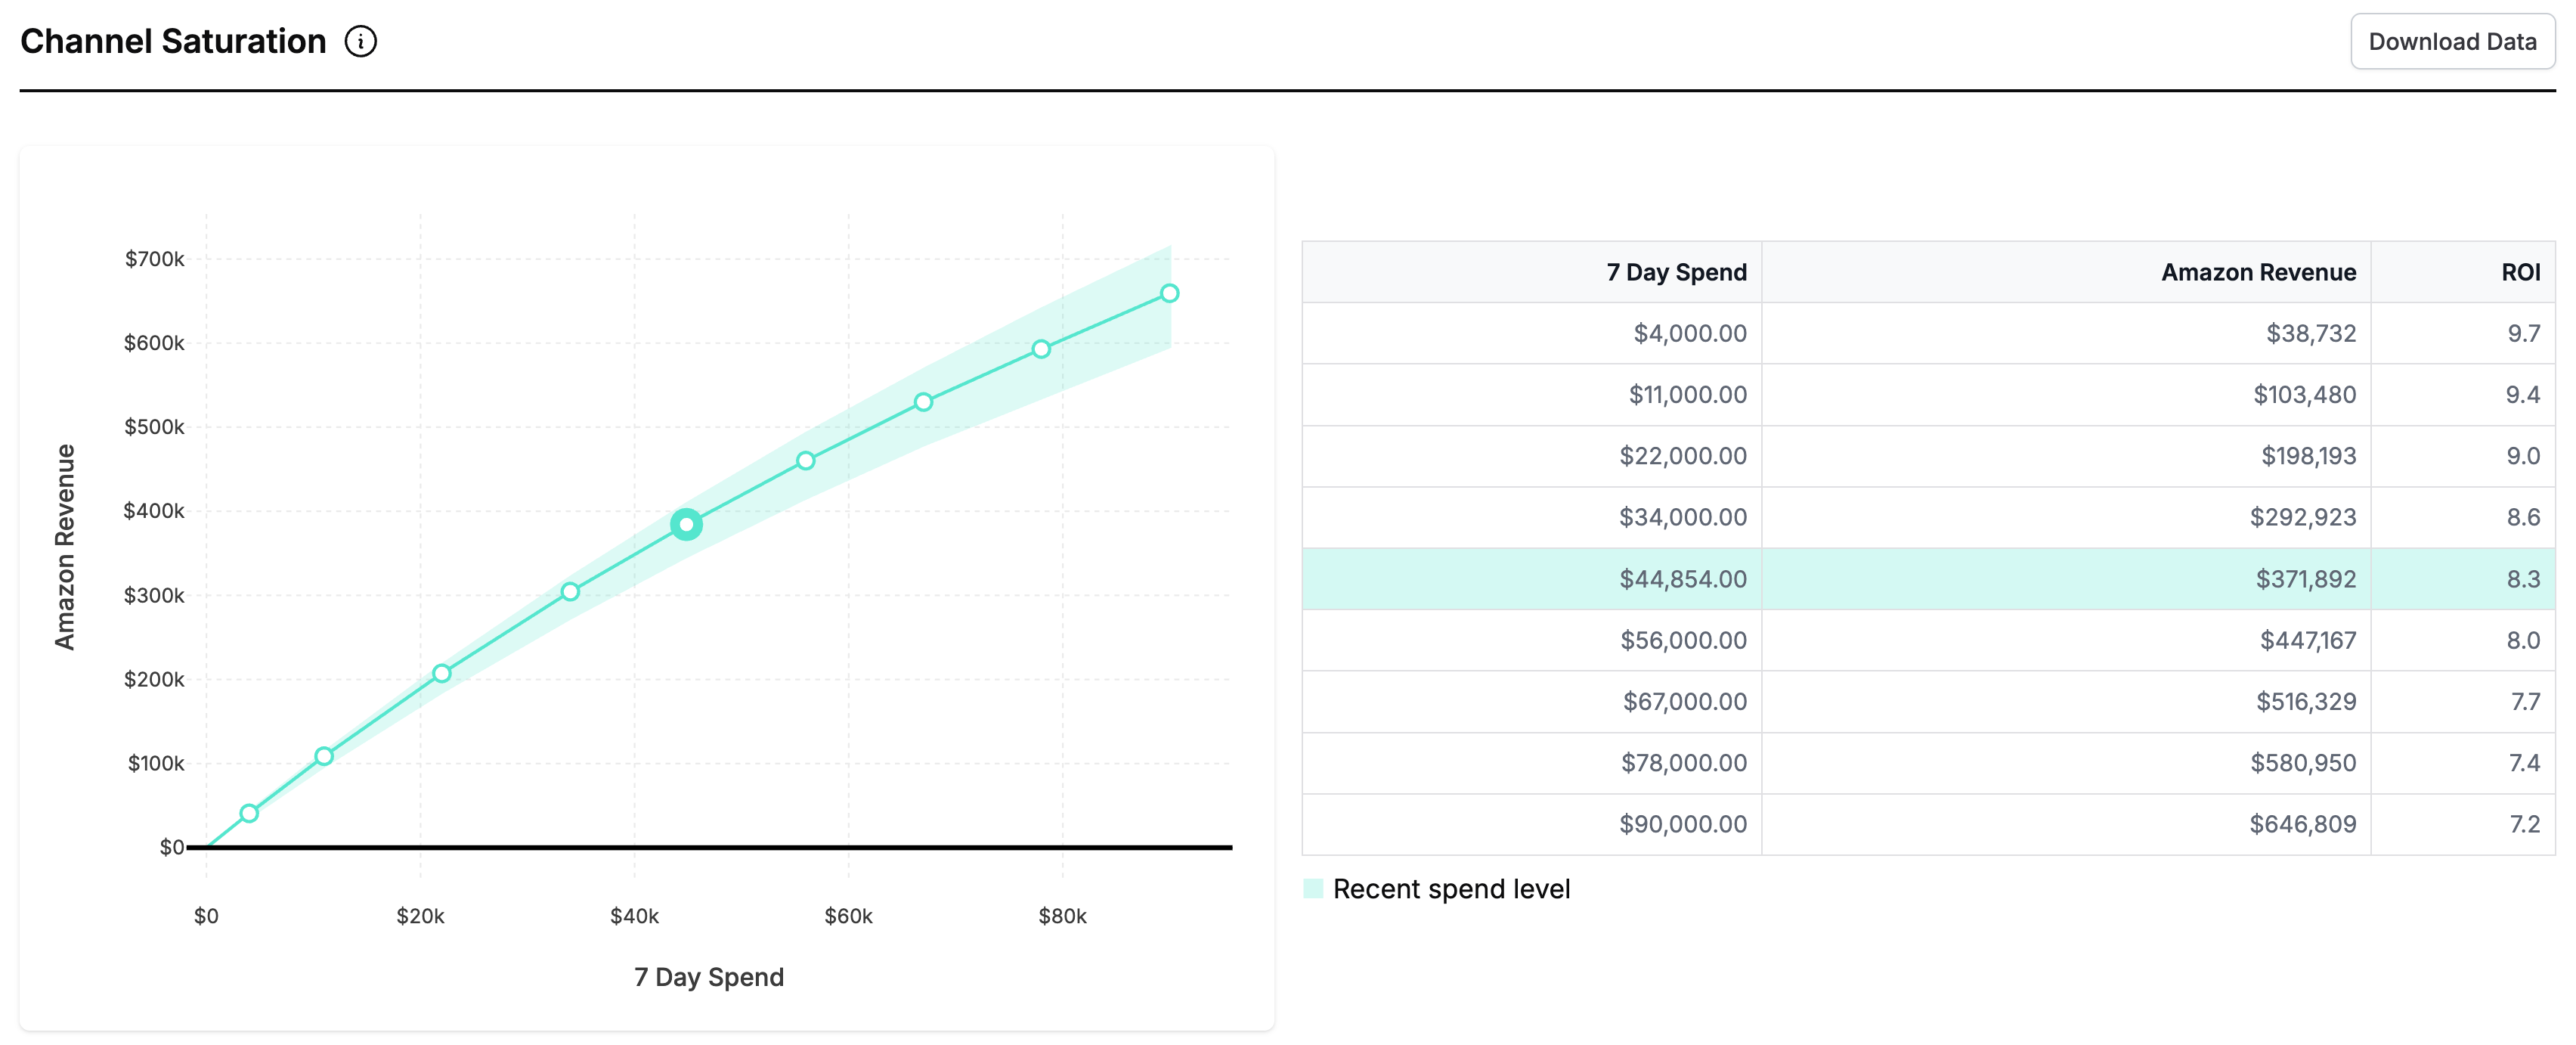
In the table, you will find impact and ROI calculations for the proportions of historical spend. The highlighted value in the table is your actual recent spend over the selected period.
How It Works
-
The report retrieves the actual spend for the selected lookback period. If no recent spend exists, the report displays a $0 spend row and uses the most recent lookback window when there was spend for the other points.
-
When calculating the impact and ROI, the report uses the most recent estimated performance and saturation parameters (last modeled date’s betas and kappas) and assumes spend will be spread out using a similar pattern as the spend in the lookback window.
-
The report estimates impact and ROI for each spend level.
Notes:
-
The report assumes spending patterns follow recent historical allocation patterns, rather than allocating all spend on a single day or spreading it evenly.
-
The results use the most recently modeled data to determine the saturation over the entire spend period.
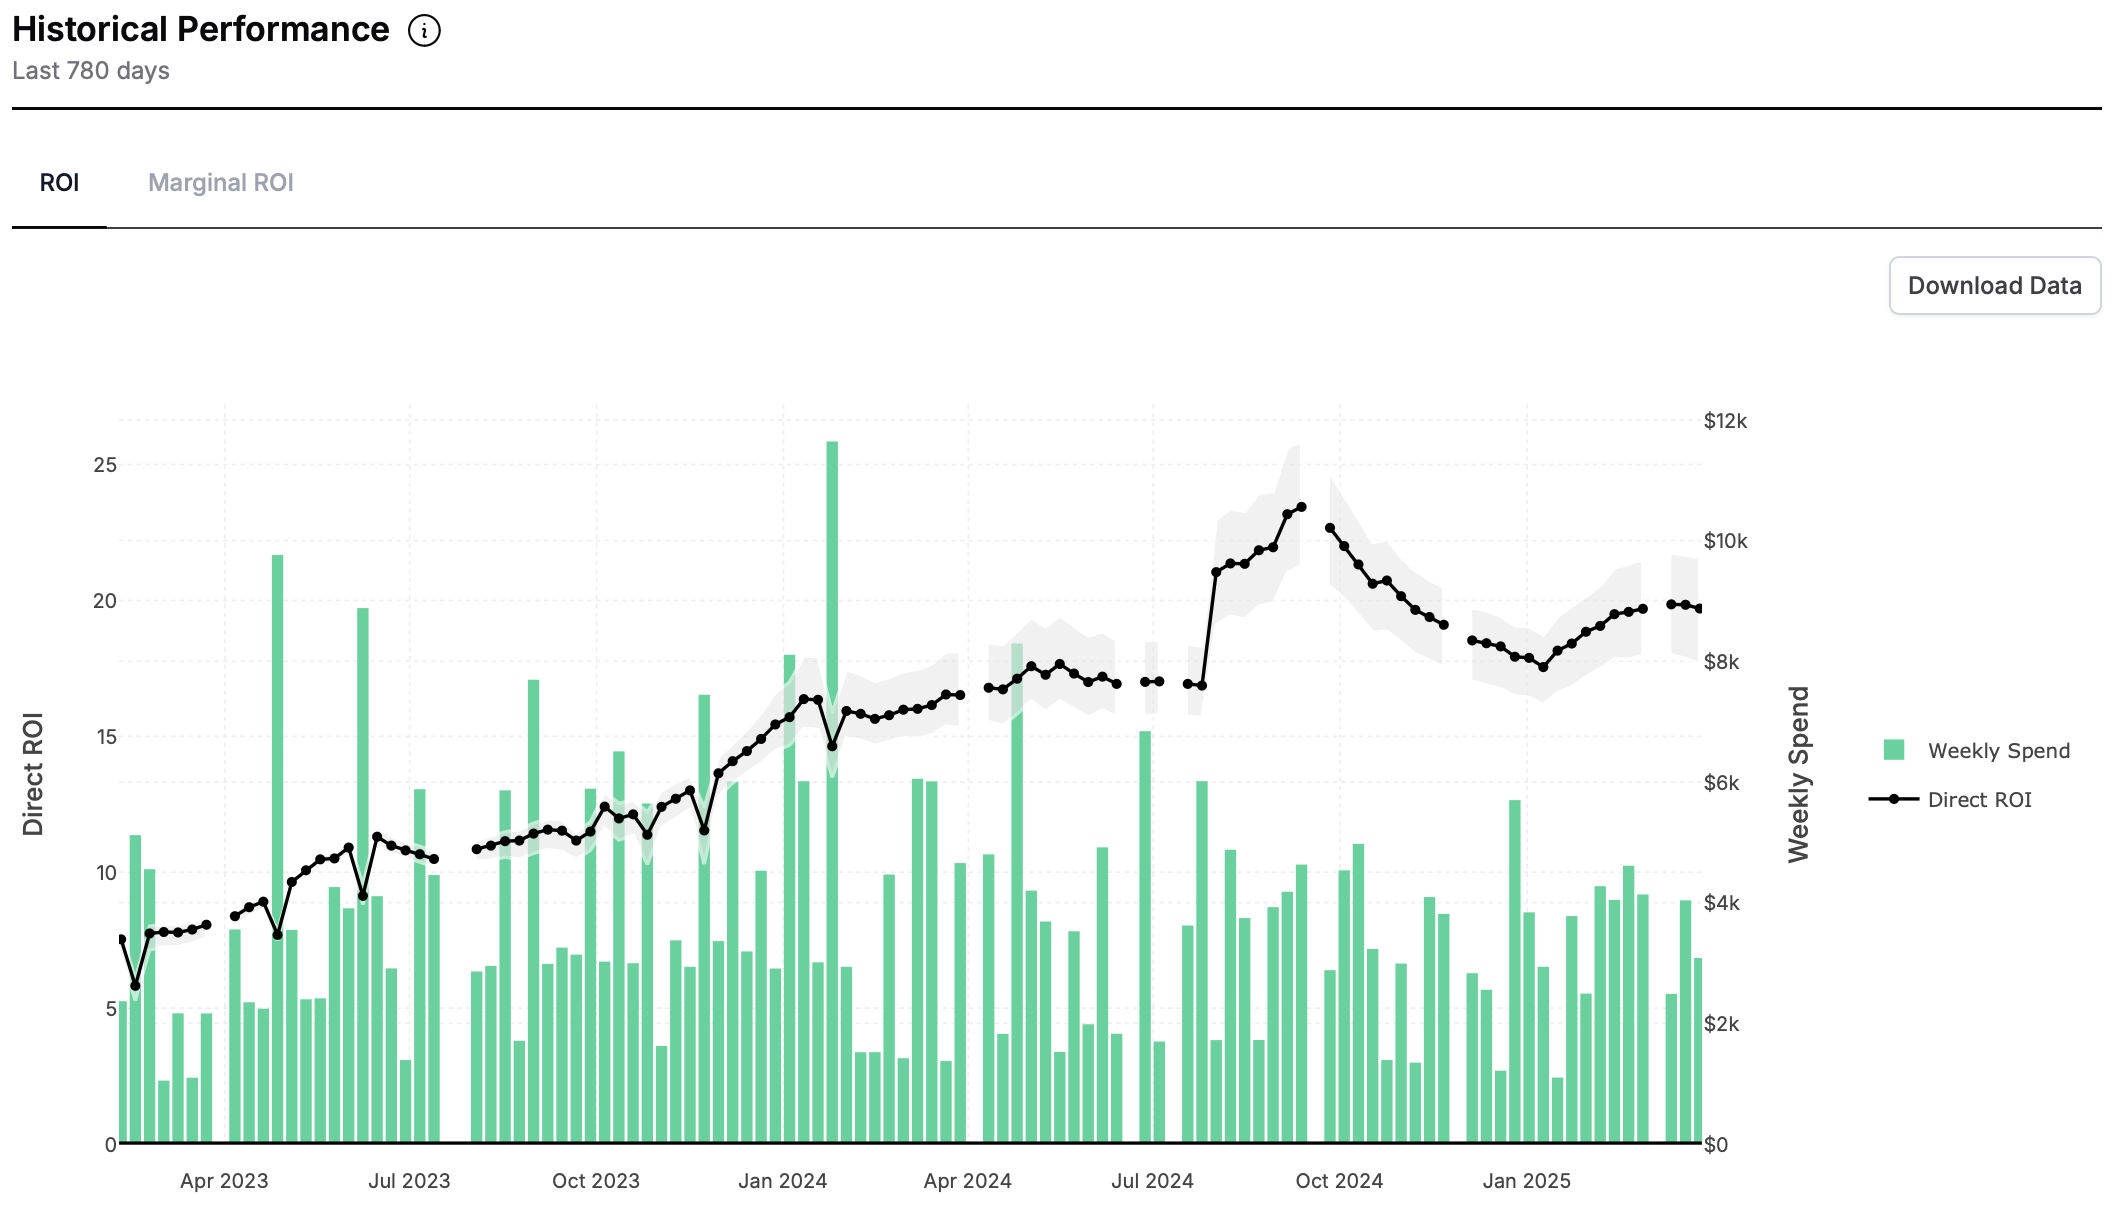
Historical Performance
The historical plots are a collection of four plots - the efficiency, marginal efficiency, impact and impact shifted over the entire period of your data. The plots show weekly spend as well as the relevant metric over the time period.
These metrics are defined as:
-
ROI: This is the earned ROI for this channel for every day in the last 12 months. Note that the ROI is earned, not necessarily realized on that day.
-
Marginal ROI: This is the ROI of the last dollar invested into the channel on that day.
-
Impact: This is the direct effect earned on that day. It is just the ROI multiplied by the spend.
-
Impacted Shifted: This is the direct effect realized on that day. It is the impact after the time-delay schedule (“shift curves” in Recast parlance) has been applied.
Channel Time Shift
The channel time shift plot shows the number of days it takes for x% of impact to be realized in the channel after budget is spent.
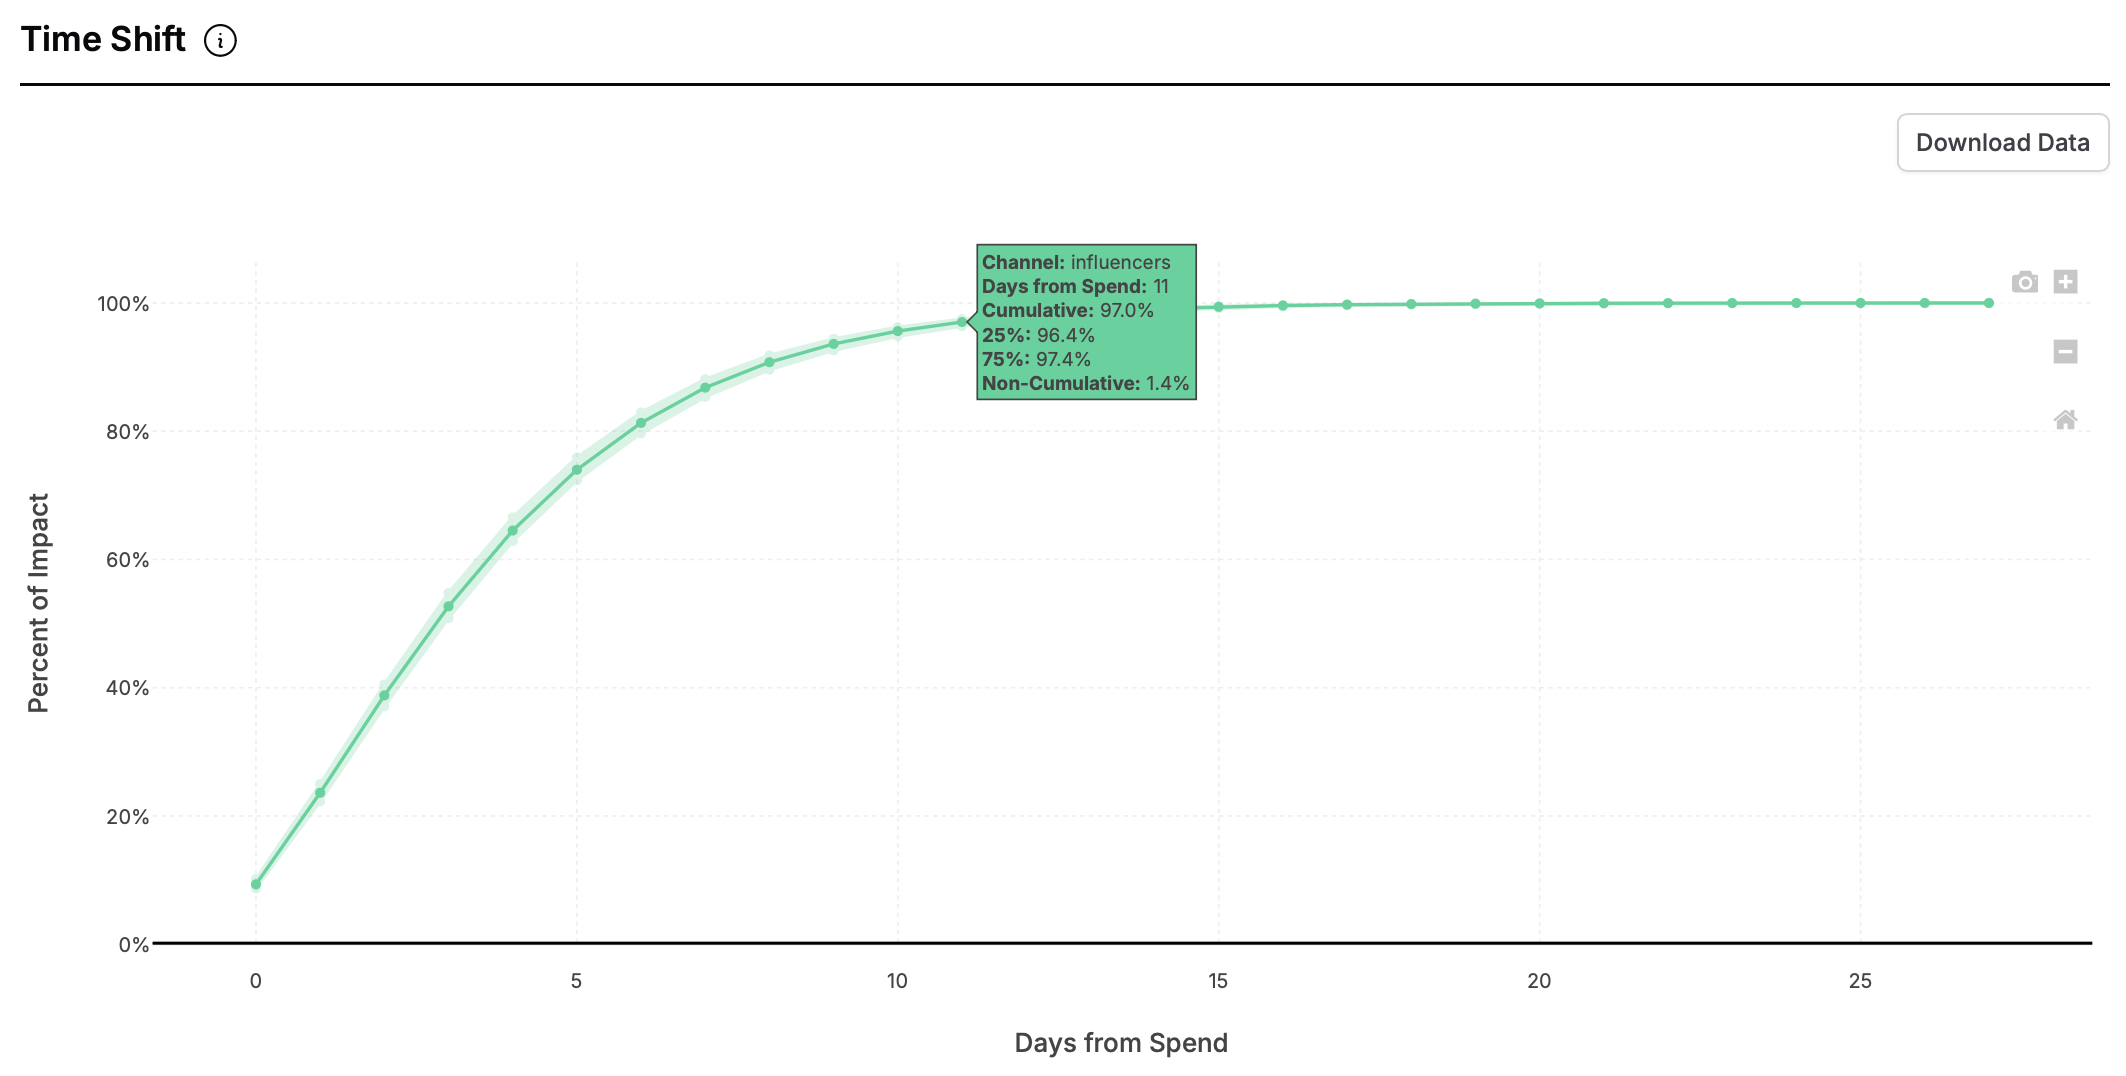
The x-axis shows the number of days while the y-axis shows the x% of impact.
Summary Table
This table summarizes up to 2 years of channel performance. The number at the top shows the spend over the time period.
Each row shows efficiency, marginal efficiency, impact and impact shifted respectively along with the confidence interval percentiles.