The ‘Last week snapshot’ is now the Overview page!
The Overview page allows you to select the date range for which you would like to see a snapshot of your marketing performance. Select from:
-
Last 7 days
-
Last 30 days
-
Last 90 days
-
Last 365 days
All date ranges are relative to the last day in the modeled data, not the calendar date.
Outcome & ROI

In the Outcome & ROI box you will see high level metrics as well as the change in each of the reported metrics comparing this period to last period, and this period to the same time last year. The metrics are:
-
Baseline Outcome: This is the estimated outcome gained in the period independent of your marketing spend from organic conversions and spikes (promotions and holidays).
-
Paid Outcome: This is the estimated outcome gained in the period as a result of your paid media spend.
-
Total Outcome: This is the total of your KPI observed in the period (not estimated). Baseline outcome and paid outcome do not necessarily add to this number for two reasons: (1) there is in sample fit error (meaning the predicted outcome does not perfectly equal the actual outcome), and (2) non-spend channels may not be accounted for. You can use the Contribution by Channel plot to see these components.
-
Total Spend: the amount spent last week (not estimated)
-
Blended ROI/CPA: This is the total return on investment calculated as Total Outcome/Spend (not estimated)
-
Paid ROI/CPA: This is the estimated return on investment of your paid media spend during the period. Some of that return may yet to be realized, and is expected to come in the future.
When "Last 7 days" is selected, the "from last week" comparison is comparing the most recent week with the week immediately before it. The "from last year" comparison is comparing the most recent week to the week 365 days ago. Similarly, "Last 30 days" will show the last 30 days compared to the 30 days before that, as well as the last 30 days compared to the same 30 day period last year. If your model does not go back far enough to make a specific comparison, that comparison will not be shown.
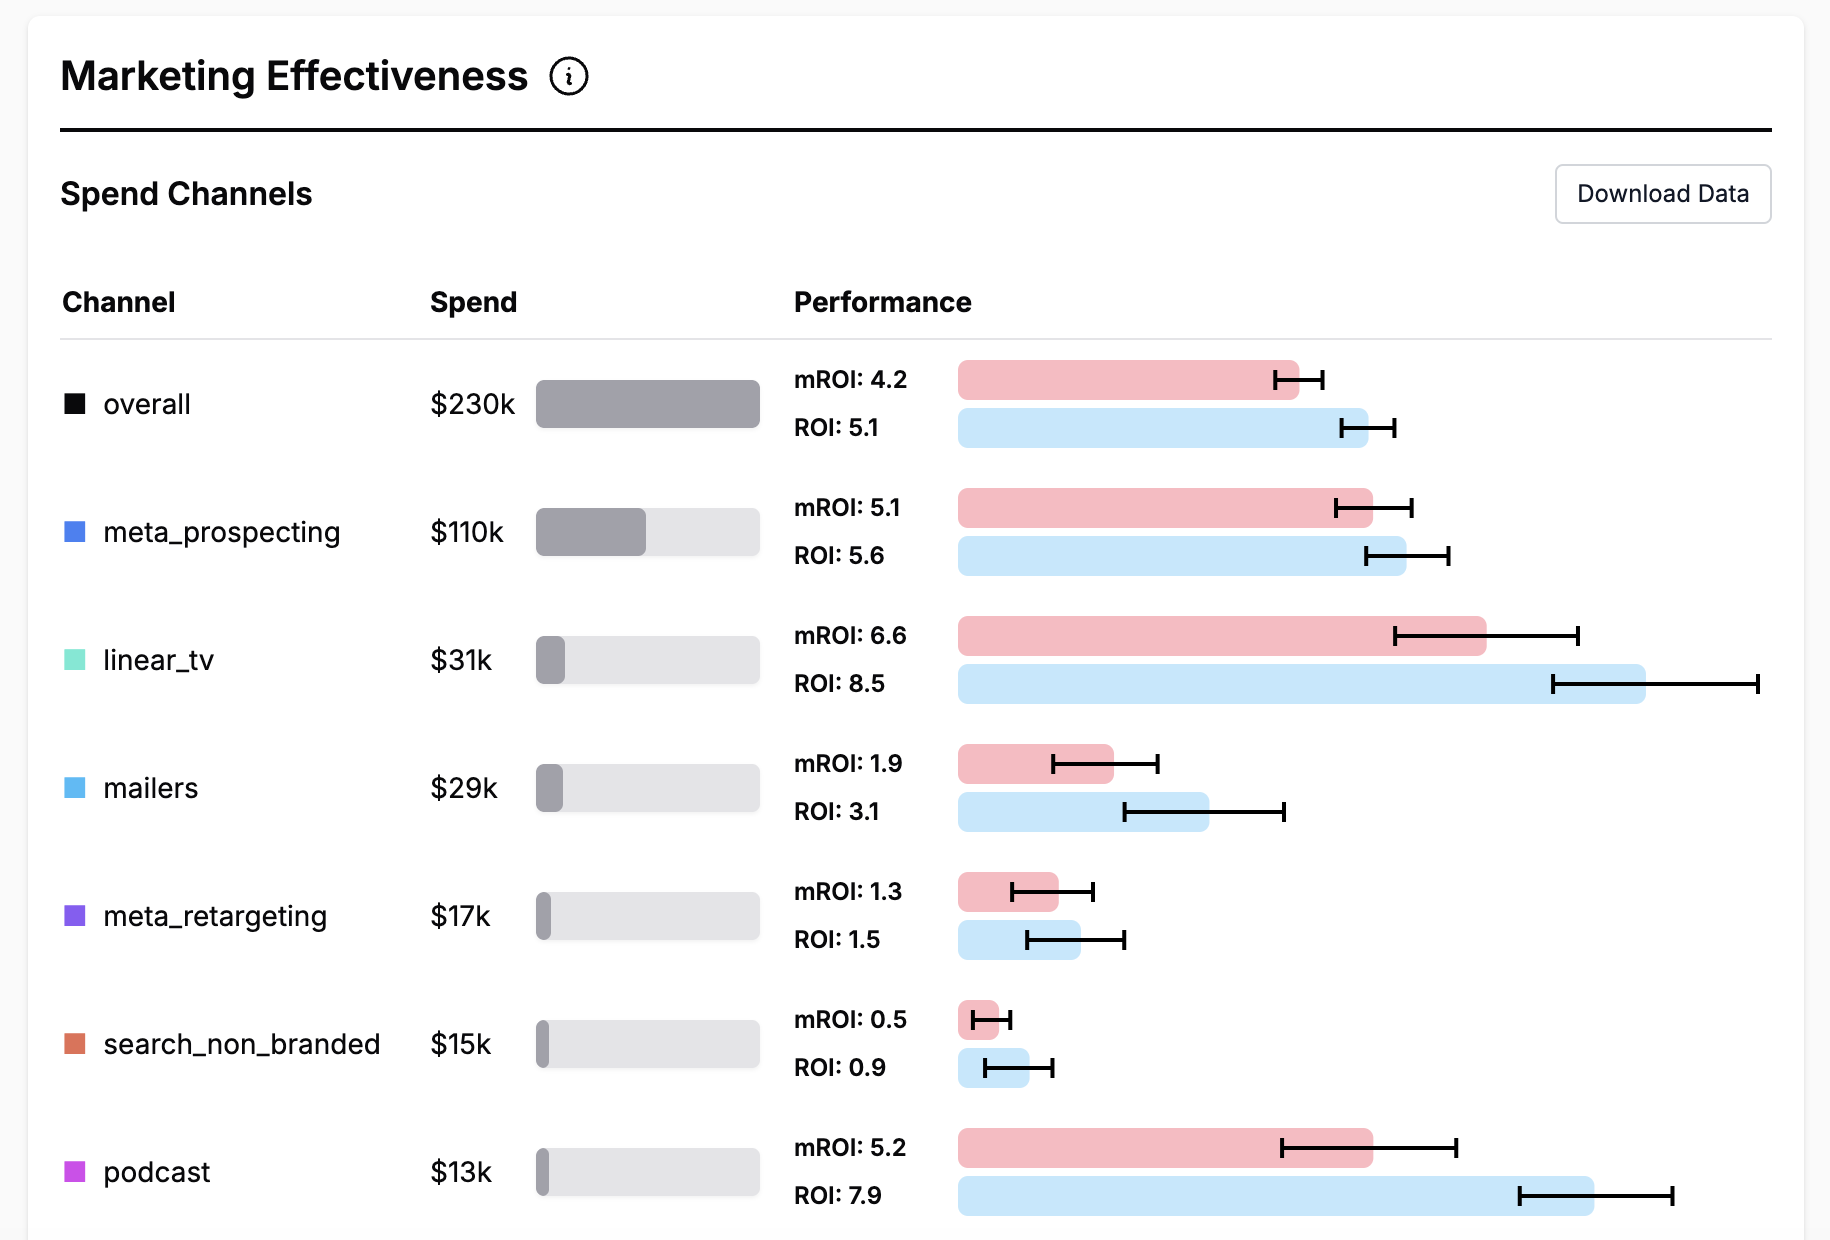
Marketing Effectiveness
The grey bars show the spend in each of your channels throughout the selected time period while the colored bars show as the ROI, MROI and Uncertainty associated with each channel.

Notes:
-
By default, the ROIs/CPAs shown are "total" ROIs/CPAs, meaning that we calculate both the predicted lower funnel spend caused by the upper funnel spend and the predicted lower funnel effect of the lower funnel spend and use these to adjust the estimate to more accurately reflect the total impact of the spend. For lower funnel channels, no additional adjustment is necessary. You can switch to “direct ROIs/CPAs” by unchecking the “Include lower funnel effects” box.
-
The confidence interval shown on hoverover is the interquartile range of the Bayesian confidence interval.
-
For CPA models, the length of the bar is scaled to the number of conversions per $1,000 spent. This makes it easier to interpret and prevents the confidence intervals from blowing up in size when the model is confident that the channel is not performant.
-
These are estimates based on the total return earned (but not necessarily realized) in time period. The model expects that additional conversions will come in the future.
-
The marginal ROI will always be less than the average ROI due to diminishing returns. You can see each channel’s diminishing returns curve on the individual channel pages.
-
The "▼" symbol represents channels that are configured as Lower Funnel Channels, which are configured differently within the Recast platform. More details are available on Lower Funnel Channels.
-
Downloads for all the confidence intervals are available at the bottom of the page.
Performance by Channel
This graph shows the channels that a have relatively high or low share of effect compared to the share of spend. Share of spend is calculated by dividing the channel's spend by the total spend in the time period. Share of effect is calculated by dividing the mean estimated direct impact of the spend by the mean estimated direct impact of all other channels. The percentage shown on the graph is mean share of effect - share of spend.
Channels that represent a large portion of the total spend compared with the amount of KPI they are driving are considered ‘underperforming’ channels
Channel that represent a smaller portion of the total spend compared with the amount of KPI they are driving present outsized returns and are considered “over-performing’ channels.
Use this graph alongside the Marketing effectiveness graph to identify channels to further explore as potential places where there is an opportunity to increase or decrease spend to improve your overall performance.

Contribution by Channel
The graph shows a breakdown of your KPI during the timeframe and how much each marketing channel contributed to that KPI based on the Recast model.
Notes:
-
The contribution by each channel shows the direct shifted impact of the channel during the selected time period.
-
The Baseline is all of the KPI that’s attributed to non-marketing, organic sales.
-
Spikes are things like promotional events, store closures, or new product launches. You can see more detail on the “Spike Summary” tab.
-
“Unexplained Variation” is due to the random variation where sometimes the model estimates miss high or low. This should average out to zero over long time frames, but within a given week you may randomly have more (or less) unexplained variation just due to randomness.
-
Channels contributing a small percentage of the total will be grouped into an "Other" channel.

Check out the Overview page in action