The Prior vs Posterior tab shows you a comparison between the model’s time shift and intercept priors and the posteriors. This helps you to see how your initial assumptions about your business compare to Recast’s measurement.
What is the posterior?
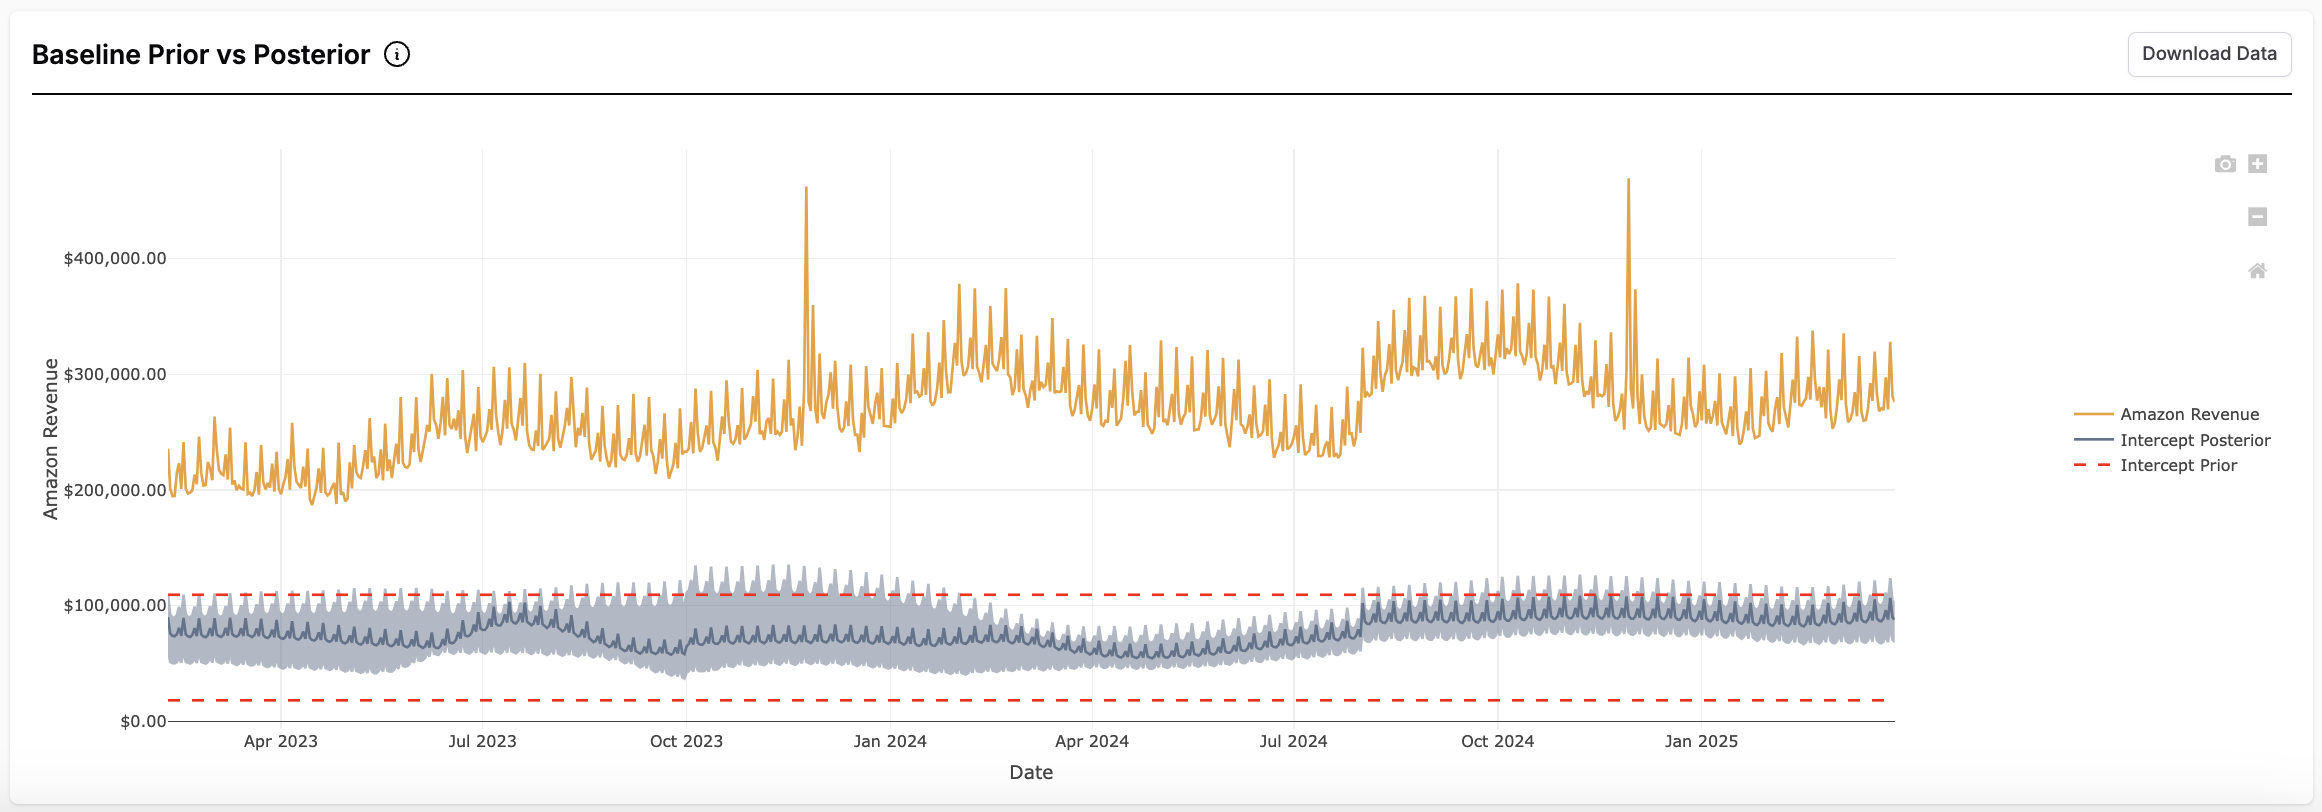
The posterior is the calculated estimate the model makes based on your past spend and return data. These include estimates of the intercept and timeshifts (channel ROI coming soon).
How to use the Prior vs Posterior report?
This is useful to help you check your assumptions about the effects of your marketing spend. It can help you visualize where the data disagrees particularly strongly with your prior estimates, and can be useful in identifying areas where revisiting the priors may be helpful.
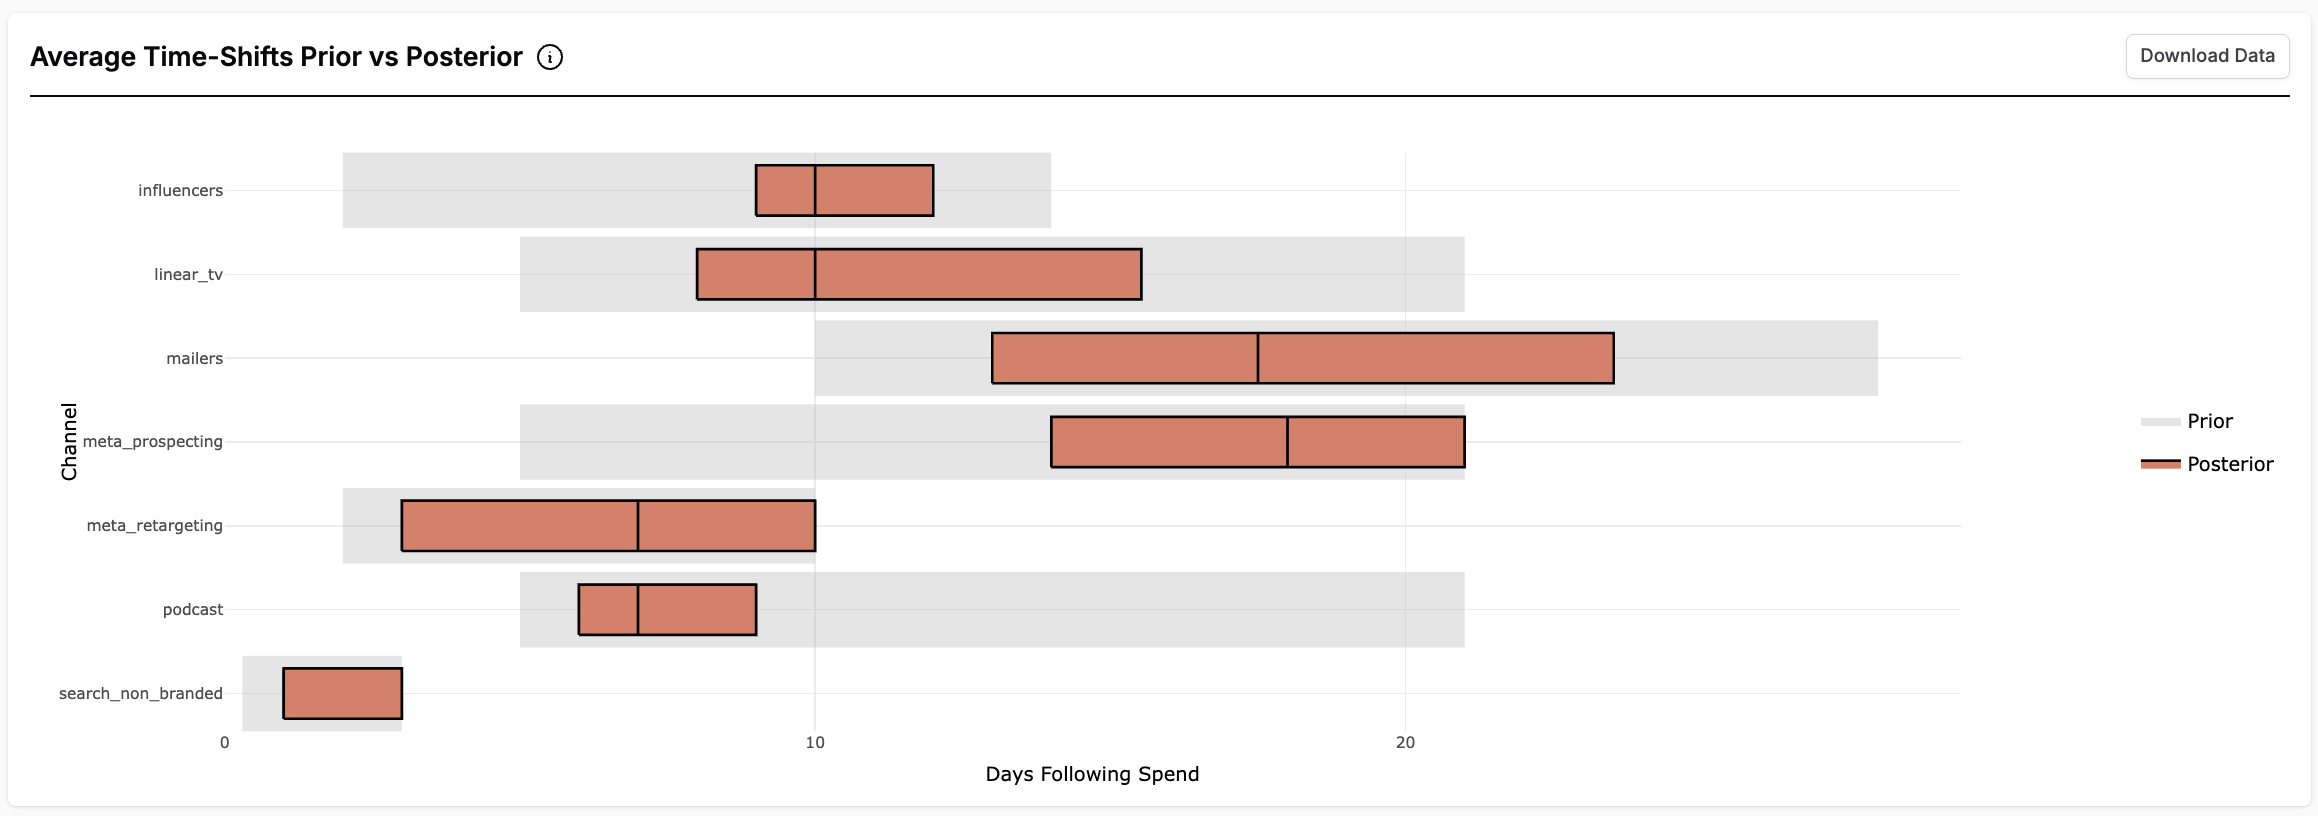
What is shown on the time shift graph?
The time shift graph show the range of days the model thinks it takes to observe almost all the impact of spend in a channel (95% of impact). The gray shows the 95% CI on the prior, while the orange shows the 95% CI on the posterior. We typically think of this number of days as the “length” of the time shift, even though a small amount of impact will continue to be observed beyond this.