
The Forecast Tab shows Recast’s prediction of a Plan’s outcome and recommendations to improve for each KPI.
Forecast Results
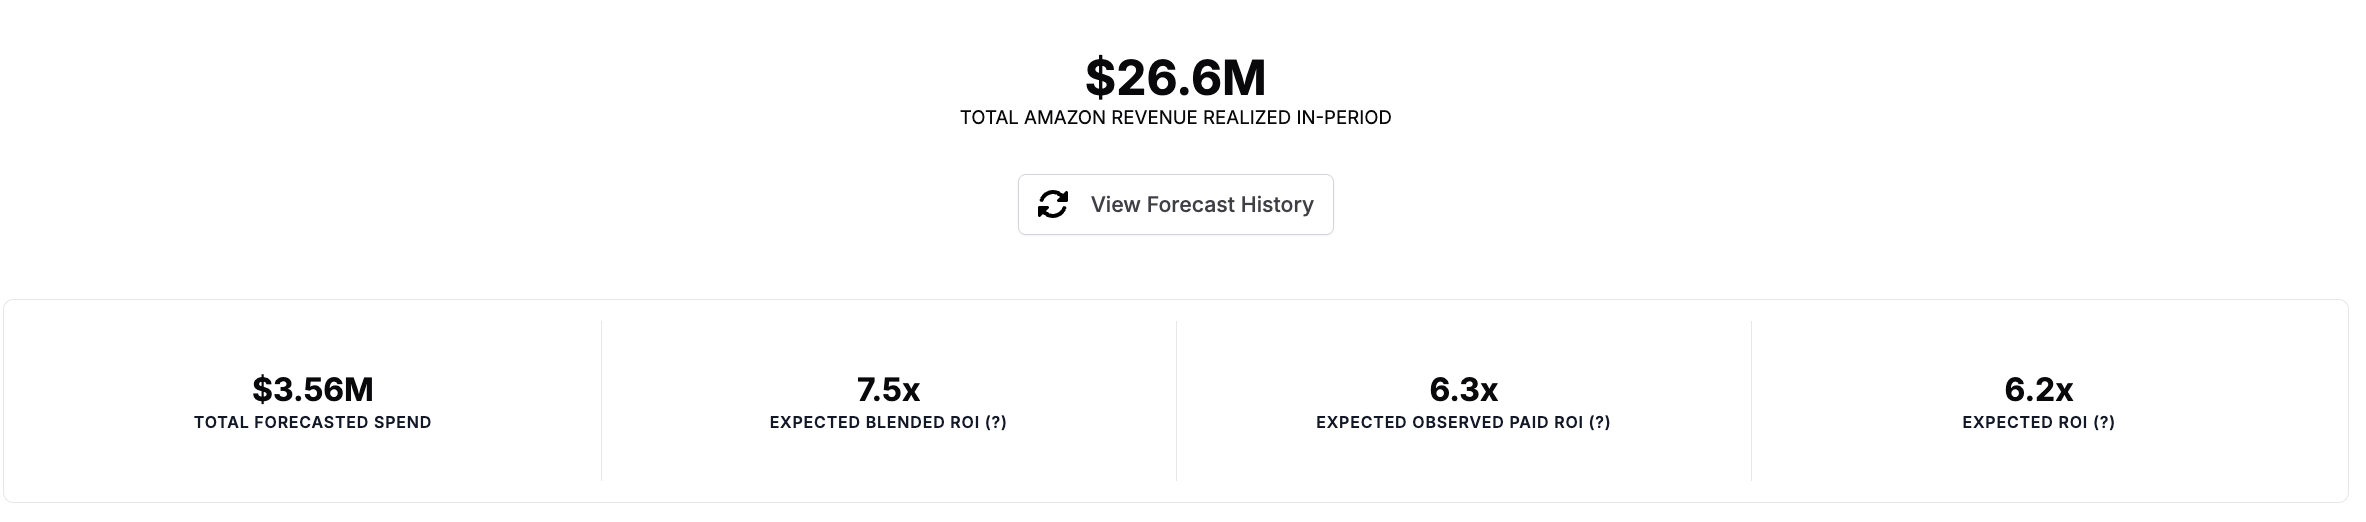
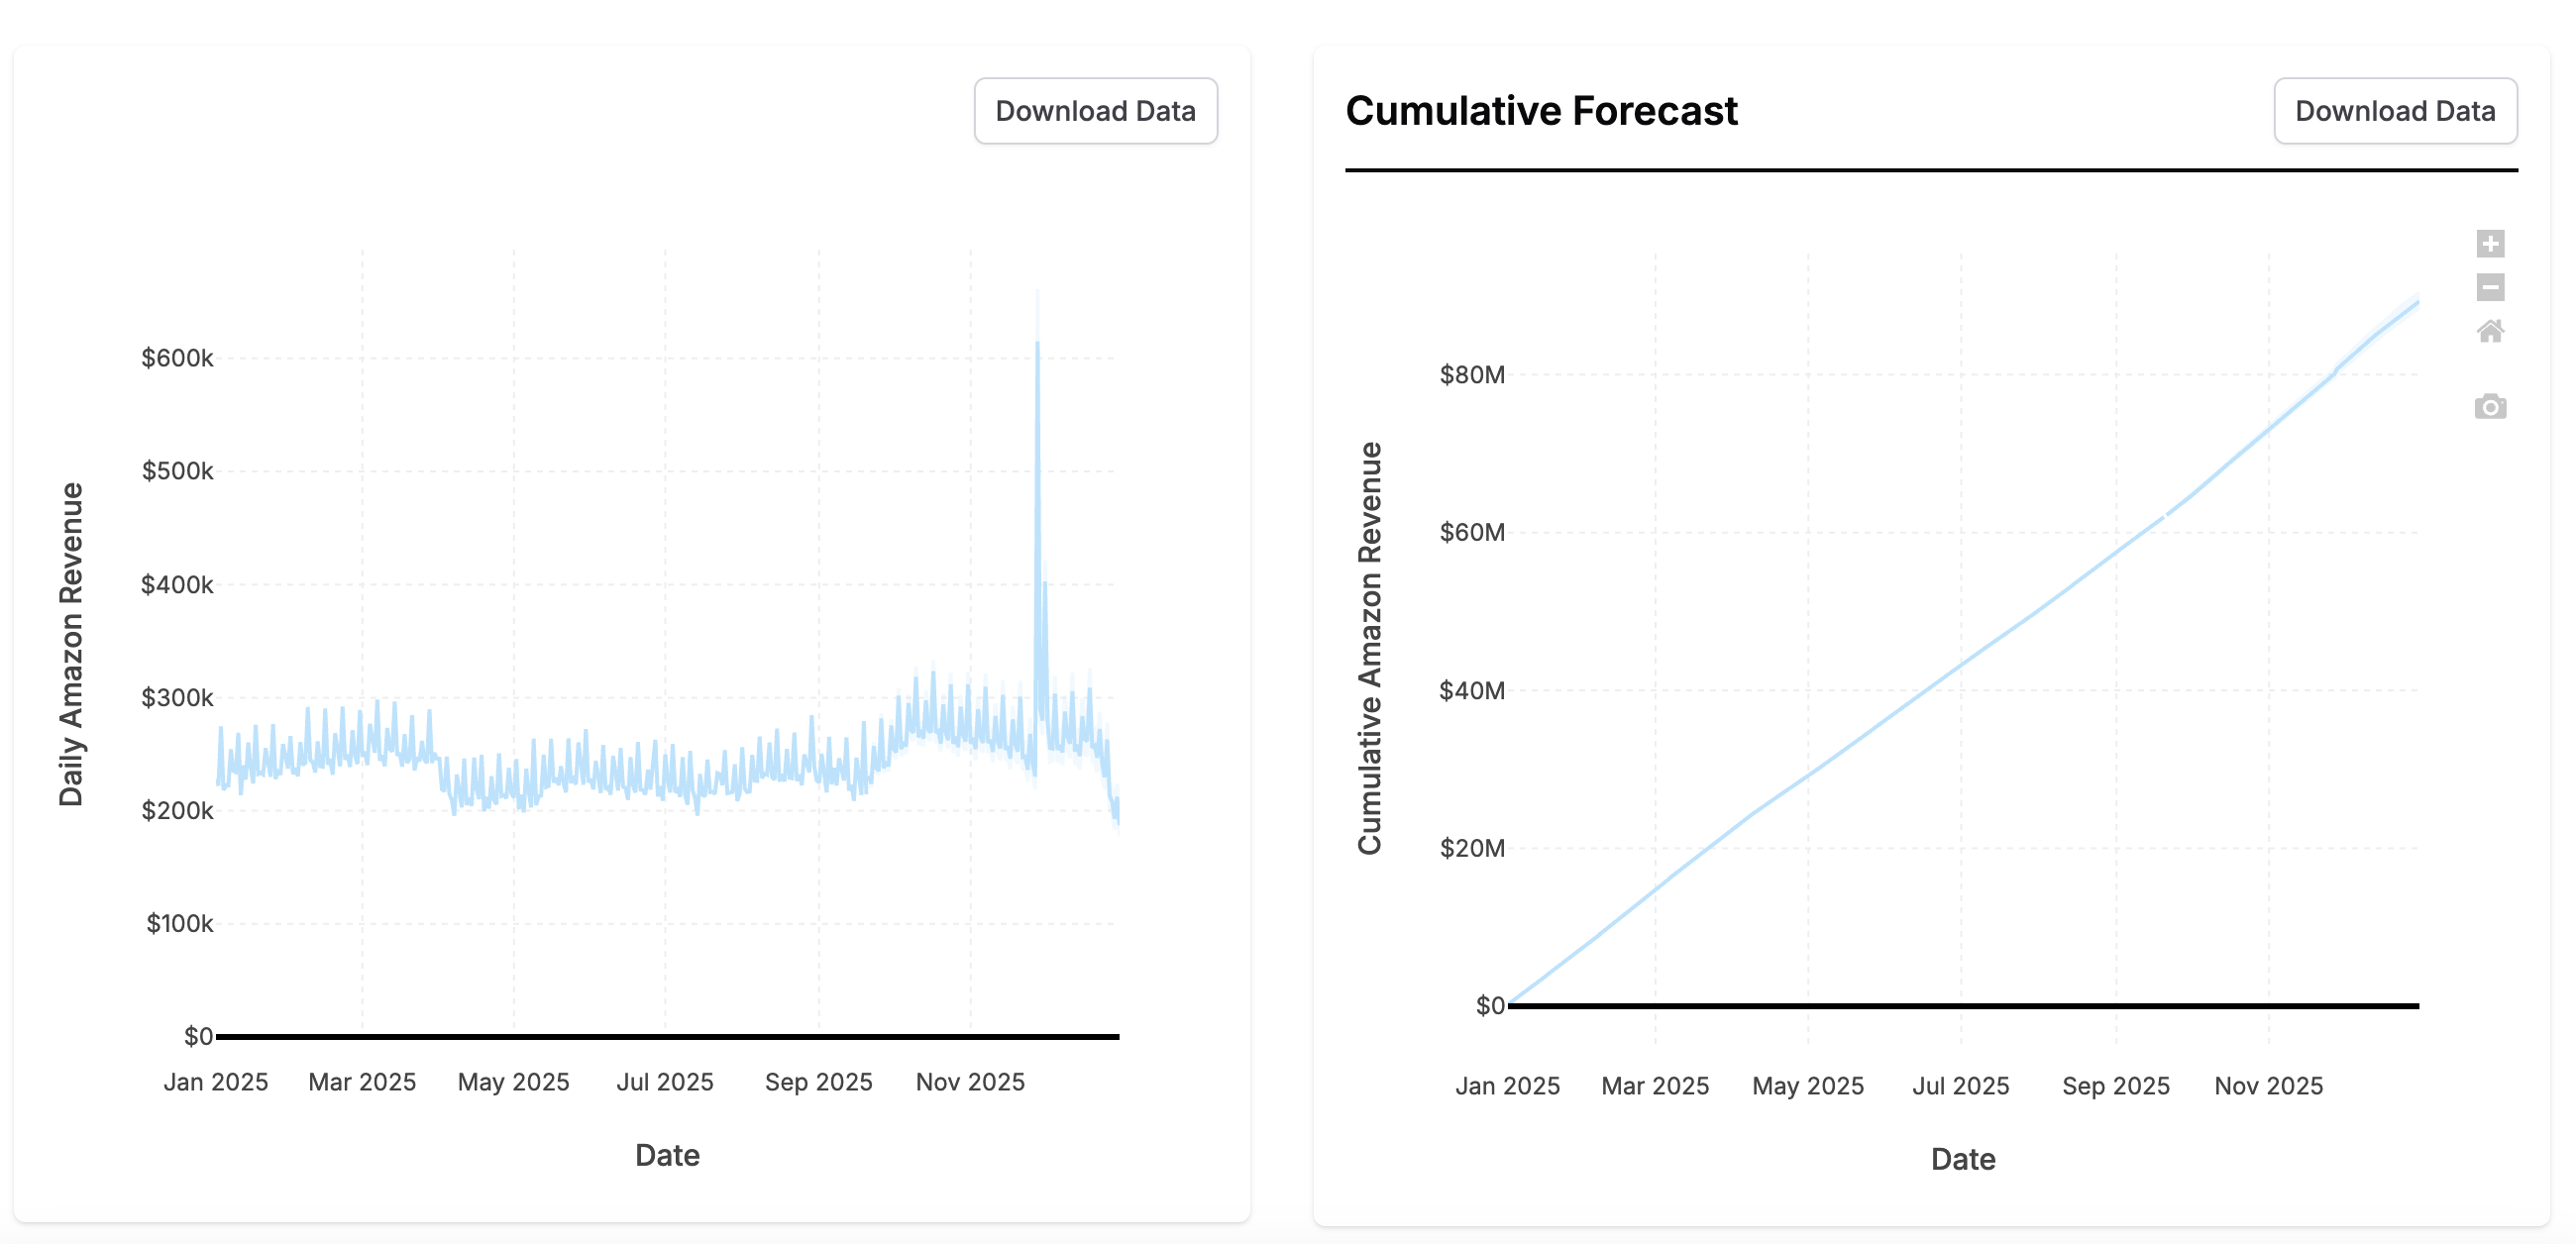
The Forecast Results section shows a forecast of each KPI if you follow this Plan. It includes all the results you’re used to from our Forecasting tool.
-
Total KPI realized in period: the expected outcome as a result of your Plan in KPI terms including both the future forecasted outcome and the actual outcome realized.
-
Total Spend: the spend in your plan including the predicted lower funnel spend
-
Expected Blended ROI: ROI expected from the spend and organic outcome expected in the Plan period.
-
Expected Observed Paid ROI: ROI expected from the paid marketing in the Plan period.
-
Expected ROI: the ROI expected from paid marketing during the Plan period accounting for outcome realized after the Plan period.
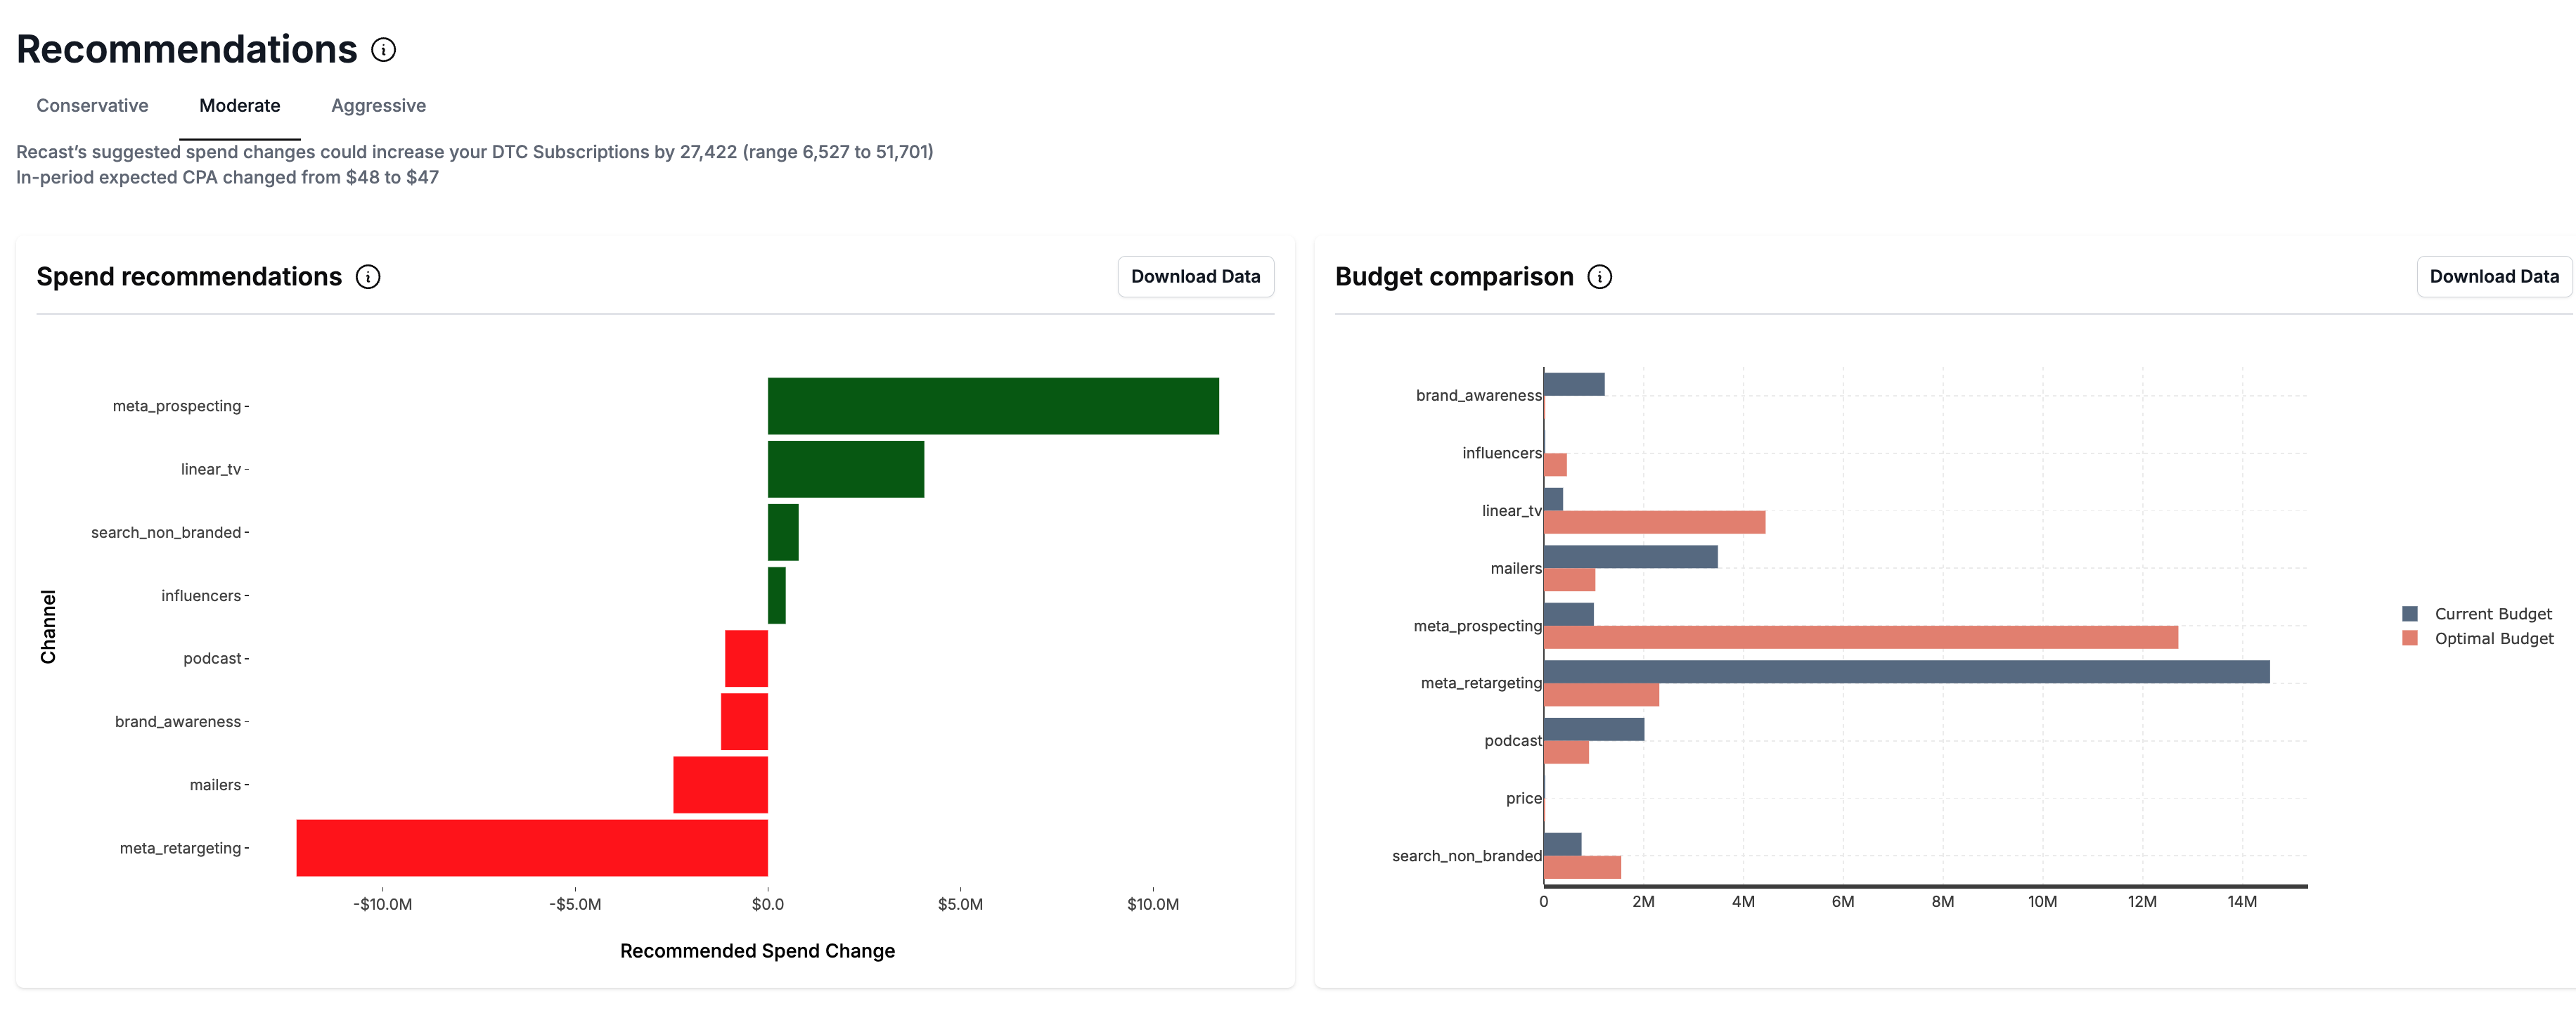
Below the forecast results, you’ll get a Recommendations on how to change the Plan to increase the forecasted KPI.
Forecasting Plans that start in the future
If a Plan starts in the future, we need to make assumptions about what will happen between the most recent historical data and the Plan start date. This is because your spend leading up to the planned time window will affect the forecast in the planned time window (due to time shift effects). In order to automate this process, we merge your Plan with the Default Plan to obtain the full budget used in the Forecast. If your model has data through the end of May, and your Plan is for July, the following values will be used when forecasting:
|
Date Range |
Data source |
|---|---|
|
< May 31st |
Historical data in the model |
|
June 1 - June 30 |
Default Plan |
|
July 1 - July 31 |
Plan |
The Forecast will be trimmed to only show the expected KPI during the month of July. If you have KPIs supported by multiple models, we will follow the same approach, always using as much historical data as possible and only using Default Plan data when nothing else is available.
Re-running stale Forecasts
When a Plan is updated, Recast will create a new Plan version and update your forecasts with the latest Plan.
When the Recast model is updated, Recast will automatically update your Plans with Forecasts using the latest model.
All previously run Forecasts will be available to view in the Forecast History which can be accessed by clicking the ‘Switch Forecasts’ Button. You will be able to click back to view all previous Forecasts. Each Forecast in the History will be tagged with a version number associated with the Plan version with which the Forecast was run. Each edit made to the Plan produces a new Plan version.
The Uncertainty Contribution
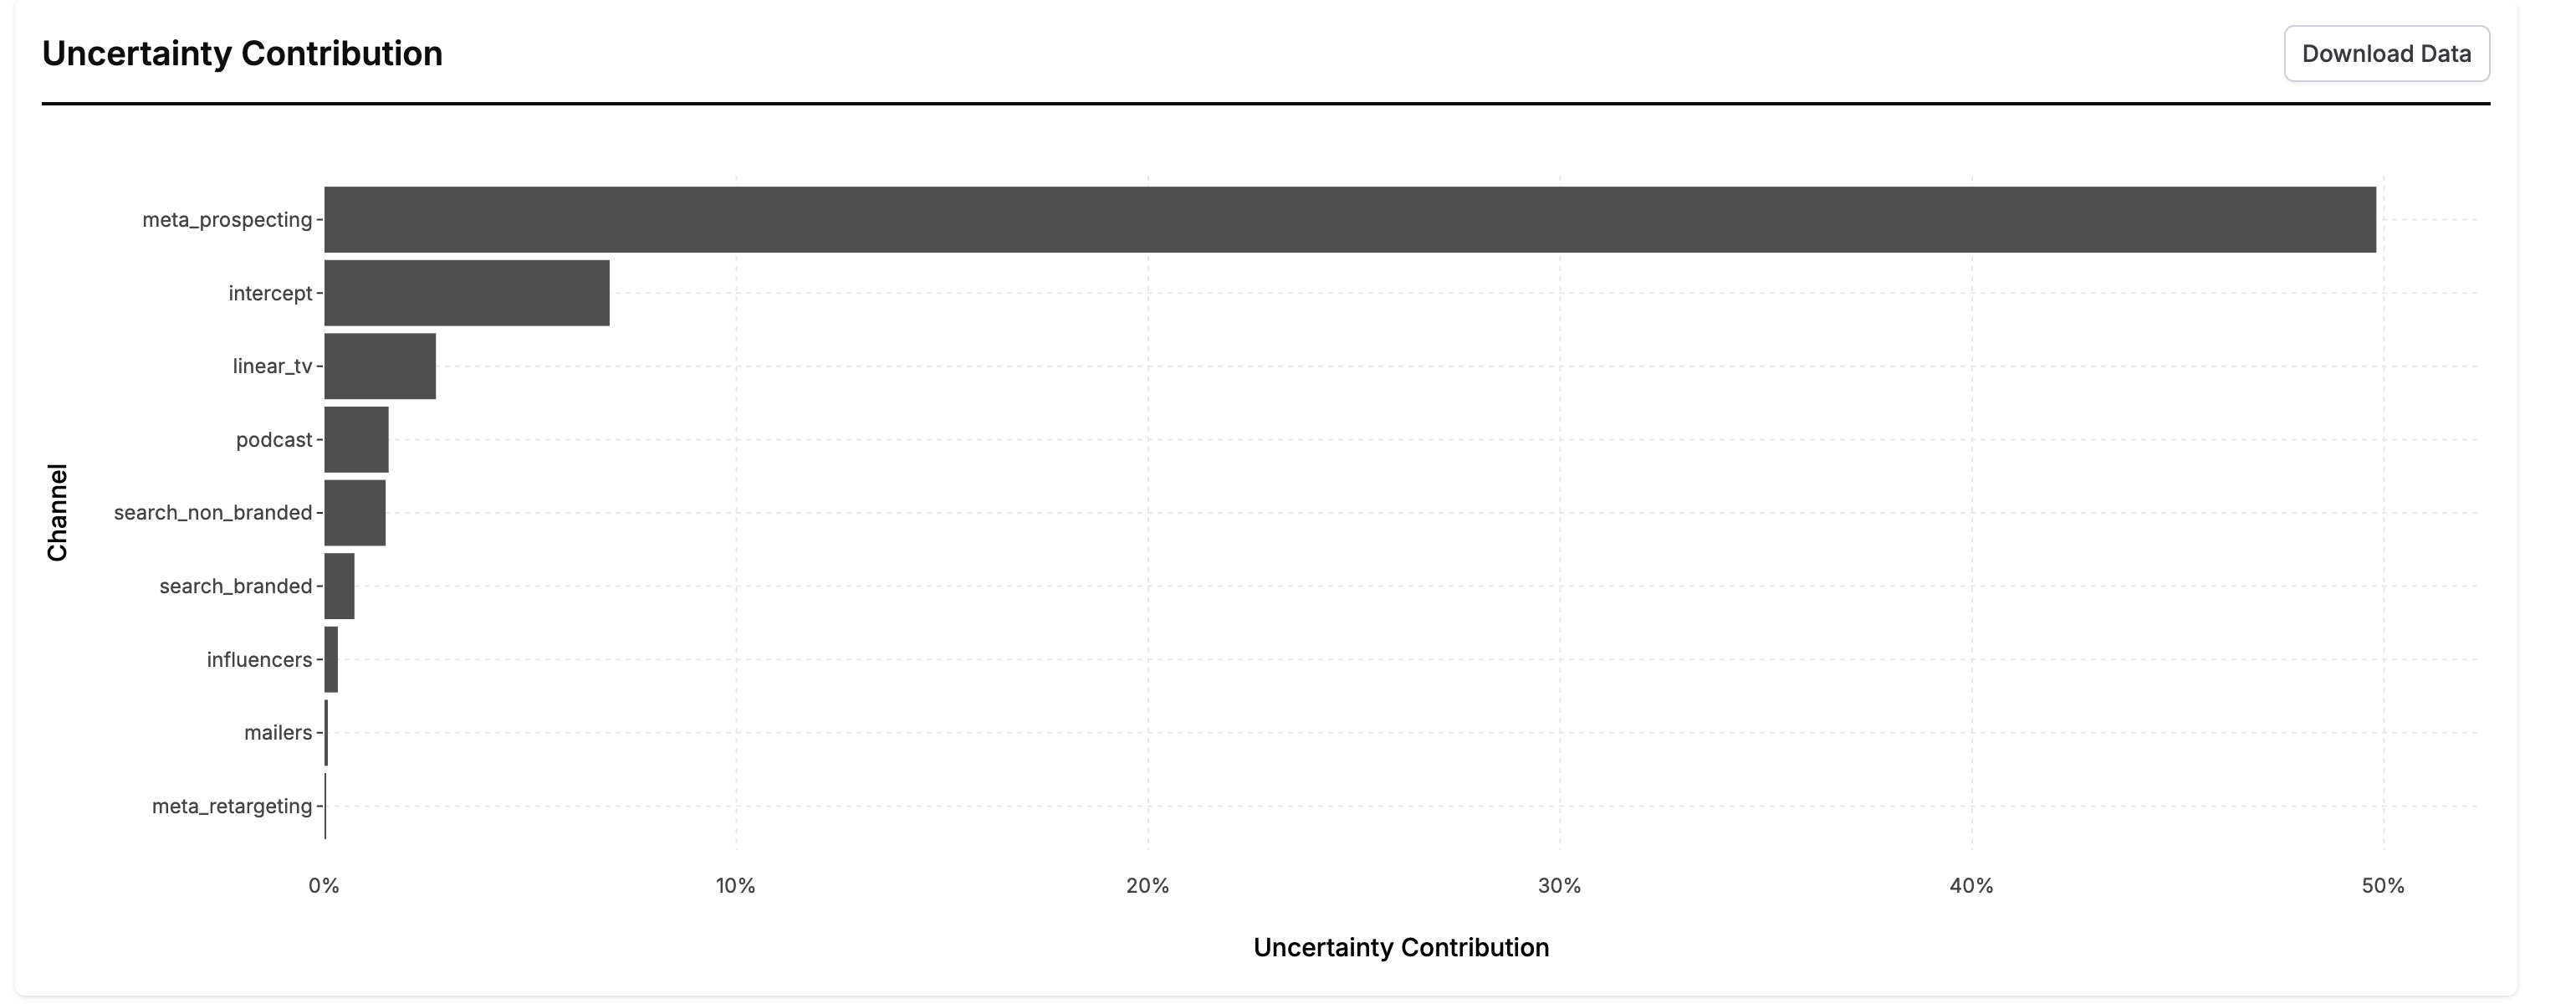
This chart is created by running a special analysis to partition the uncertainty in the forecast results to each various component of the forecast. You can interpret this chart by saying “If we knew the value of [channel] exactly, our overall uncertainty in the forecast would decrease by x%.” These numbers will add up to somewhere between 0-100%. The further these numbers are from 100%, the more inherently uncertain the forecast is (the uncertainty in the forecast is largely driven by the error term).
Channels with high uncertainty can be good candidates for incrementality tests because they show you where reducing uncertainty in a channel will most reduce uncertainty in your ability to forecast.