
Once Recast has data for your Plan period, the “Track' tab in your Plan will begin to populate with data on how your actual spend and outcome compare to the Planned spend and predicted outcome.
Using the Counterfactual section, you can see how your actual outcome compares to what Recast predicts would have resulted if the spend was executed as planned.
Using the Adherence section, you can see identify channels where actual spend deviated from the Plan.
These two sections provide insight into the success of a Plan both in terms of execution and impact.
Counterfactual Analysis
Counterfactual Analysis presents side-by-side comparisons of three scenarios:
-
Planned Spend: What the model predicts would have happened if the original Plan was followed.
-
Actual Spend: What the model predicts should have happened based on how money was actually spent.
-
Actual Results: What actually happened - based on observed historical data.
This comparison helps answer the key question- What would have happened if we had spent differently?
Using this section you can quantify the impact of your adherence to the Plan or evaluate alternative Plans in the past compared with your actual spend.
Key Use Cases
-
Quantifying the impact of your adherence - This section compares your predicted KPI in the case where you followed your Plan exactly with your outcome given your actual spend. This allows you to quantify the impact of deviating from your Plan.
-
Evaluating alternative past Plans - This section allows you to create alternative past Plans to see how the outcome of the Plan you decided to execute compares with the alternative Plan.
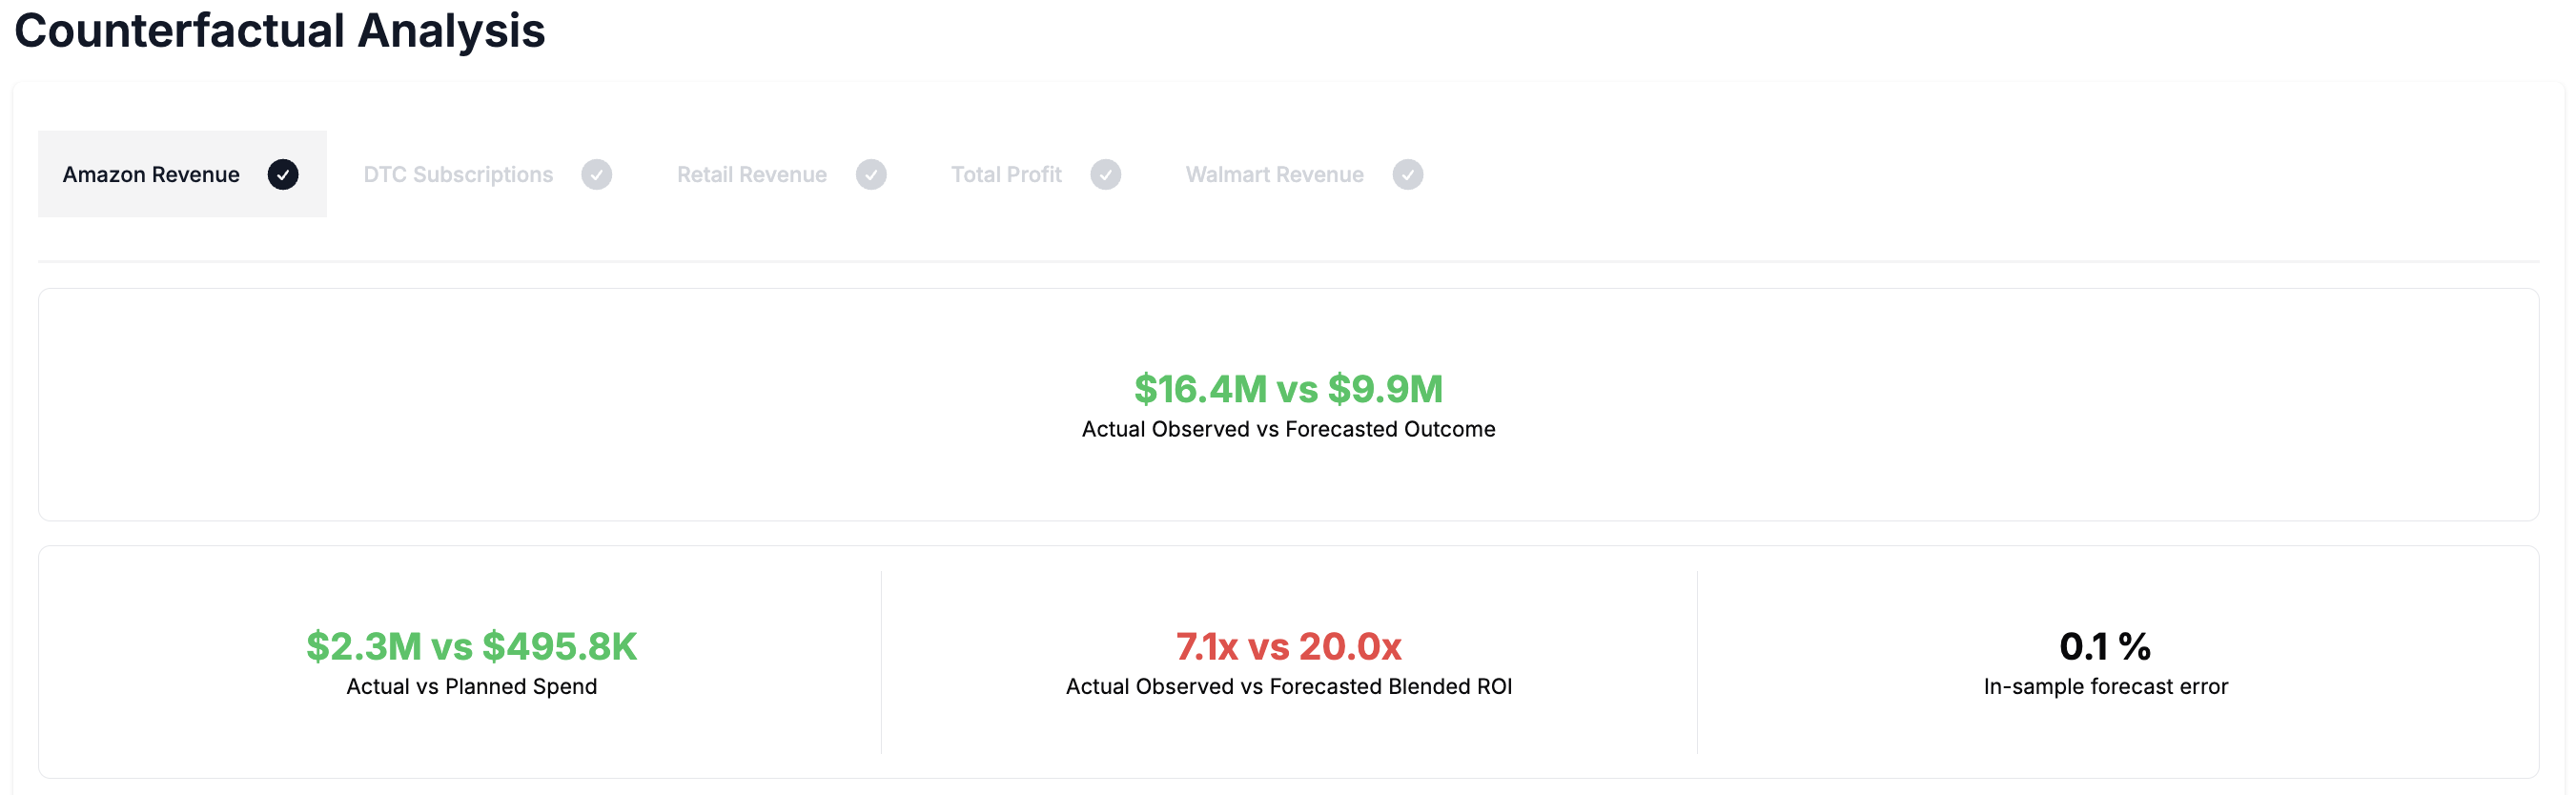
Highlight values
NOTE: all forecasts are based on the latest Recast model.
-
Actual Observed vs Forecasted Outcome - How much more (or less) revenue did you generate than if you had stuck to the Plan?
-
Actual vs Planned Spend - How closely did your actual spend match what was planned.
-
Actual Observed vs Forecasted ROI - How did your actual observed efficiency compare to expected efficiency of your Plan?
-
In-sample Forecast Error - How close was the model’s prediction to reality for what you actually spent? This is calculated as the difference between the actual outcome and the forecast of the actual spend divided by the actual outcome as a percentage.
All metrics use green for desirable results, red for undesirable. In the case of CPA estimates, the case where the actual observed CPA is higher than the forecasted CPA will be a positive value shown in red since this is an undesirable outcome.
Bar Chart
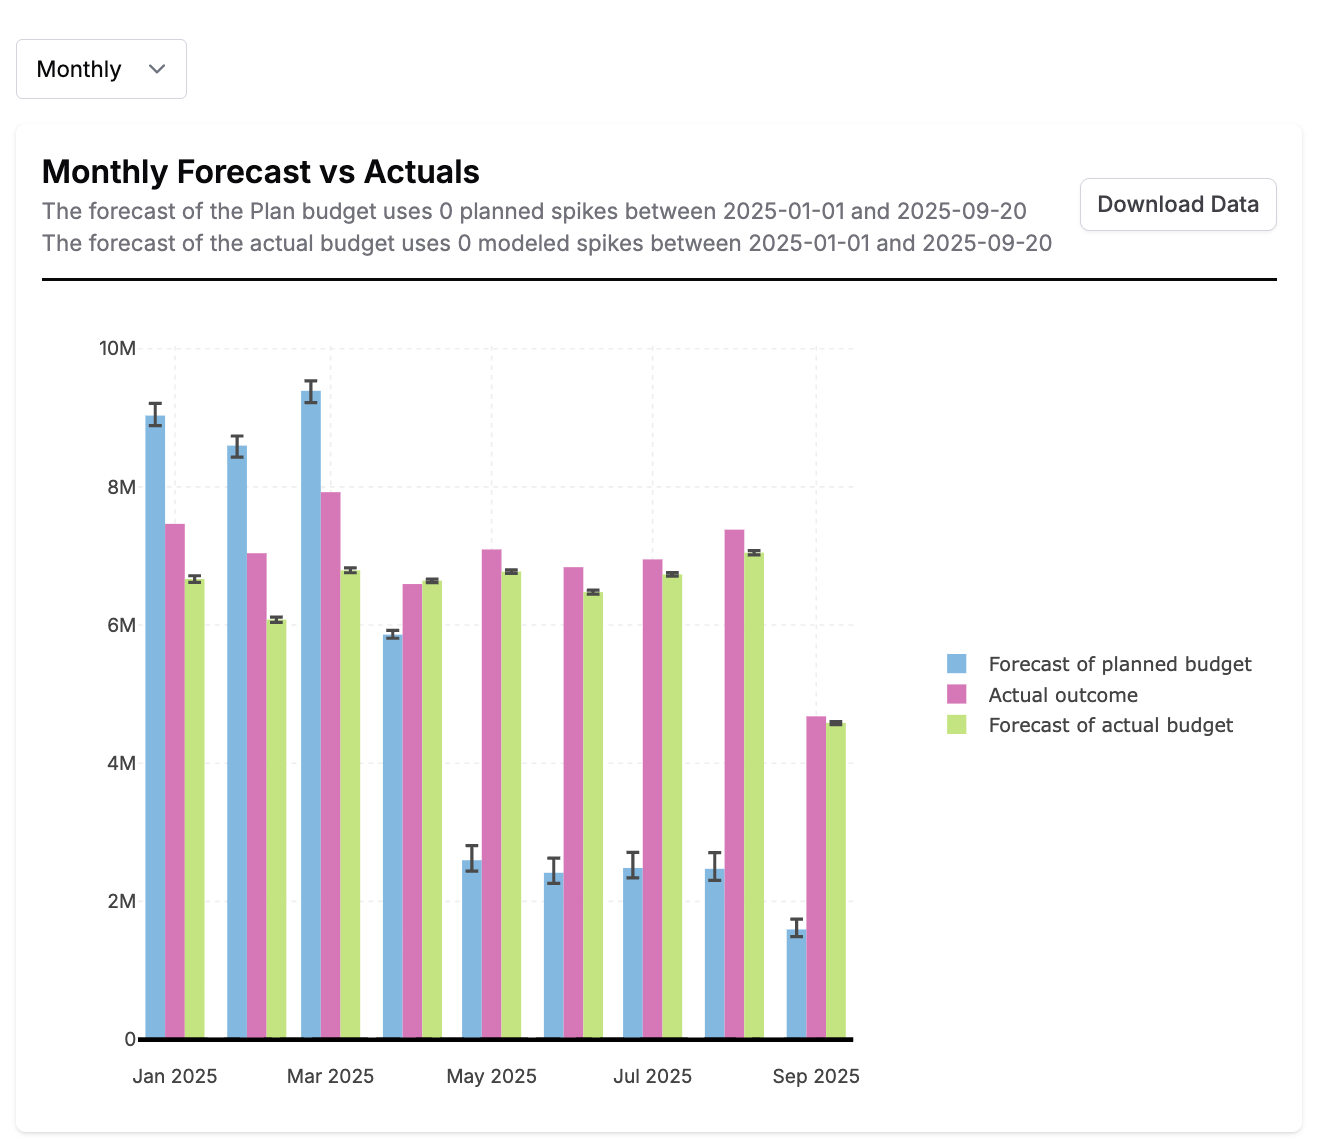
The bar plot shows a comparison between the actual observed outcome, the forecast of the Plan and the forecast of the actual spend up to the last date of data available for each KPI. You can switch between daily, weekly, and monthly views depending on Plan length. If your Plan starts or ends in the middle of a month or week, the monthly and weekly bar plots will show bars with partial data for the partial week or month.
Cumulative Chart
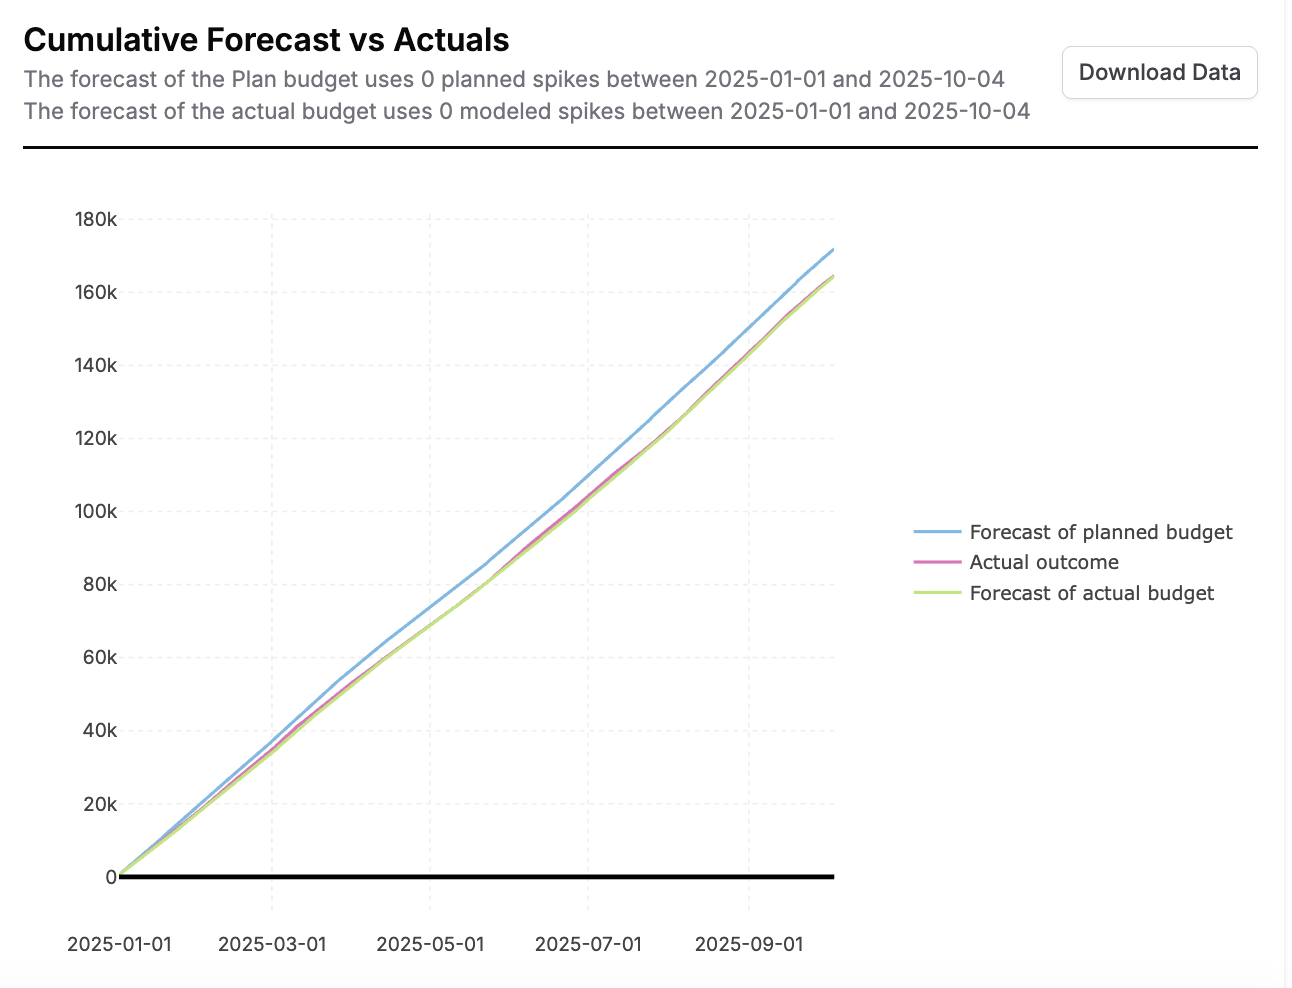
The cumulative plot shows the cumulative actual observed outcome, the cumulative forecast of the Plan and the cumulative forecast of the actual spend up to the last date of data available for each KPI with an optional toggle to include a future forecast of the planned budget.
Both plots include all the planned spikes, context variables and lower funnel settings in the forecast of the planned budget and the actual modeled spikes, actual context variable values and lower funnel spend during the period in the forecast of the actual spend.
Tables
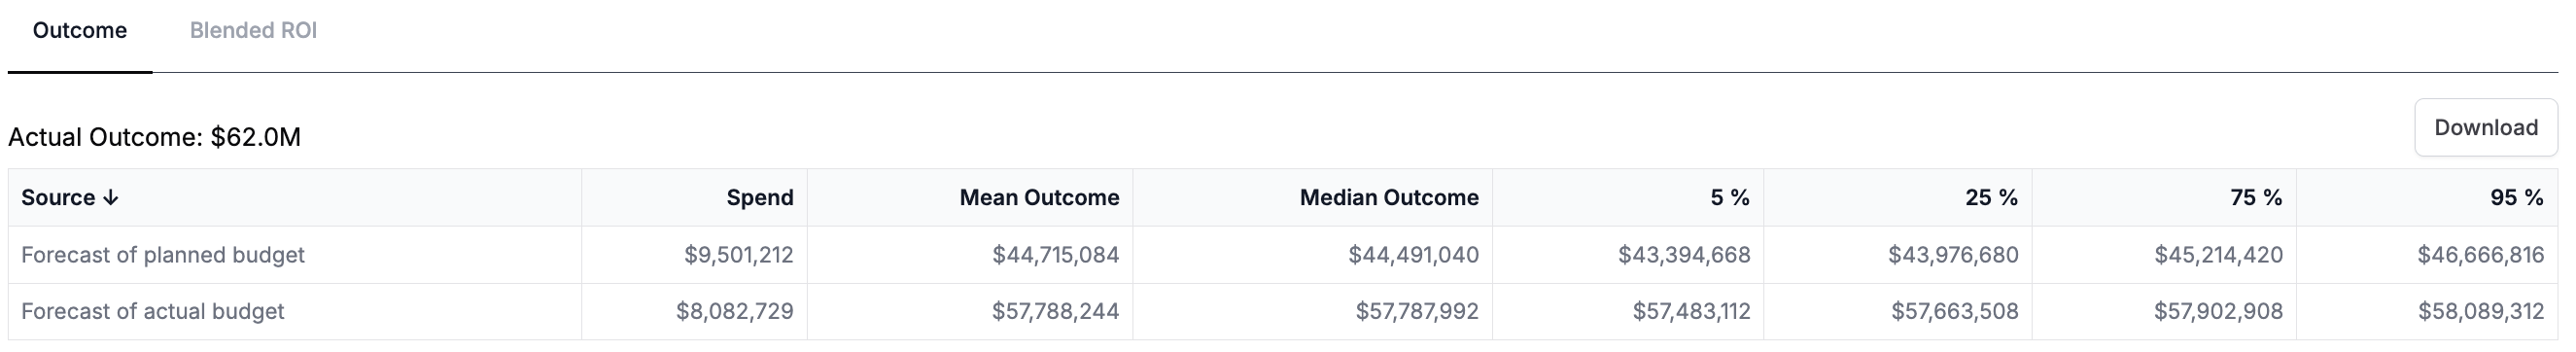
-
Outcome Table: Compare the actual outcome with the forecast of the planned budget and the forecast of the actual spend up to the most recent date of data.
-
Blended ROI Table: Compare the actual observed blended efficiency with the forecasted blended efficiency based on the planned budget and the actual spend.
The counterfactual analysis section will refresh automatically when an update is made to the Plan or when your models update. All previous counterfactuals run on your Plan are available in the counterfactual history dropdown. This allows you to toggle back to see how your outcome compared to previous Plan versions and Recast models.
Adherence
The adherence section allows you to track your actual spend against your planned spend. This is useful when you want to check that you are spending in accordance with your Plan and to identify possible channels to adjust spend in. It also helps as a diagnostic tool if your forecast is different from your outcome at the end of the plan period.
All channels adherence
This plot shows the spend planned vs the actual spend in each channel from the start date of the Plan to the latest date of data available for all channels. Using this plot you can see how much you planned to spend vs how much you actually spent so far. This plot will only become available once we have actual spend data for the Plan period.
Lower funnel channels without provided spend will only show actual spend.
Single channel adherence over time
These plots show the daily planned and actual spend in each channel over the Plan period. Before we have actual spend data for the Plan, these plots will simply show the planned daily spend in each channel.
The highlights for each channel show the total planned spend in the channel vs. the actual spend to date.