Statistical modeling is complicated, and communicating about results is even more challenging. At Recast, we have adopted a set of standards across our app to make understanding the results of the modeling easier.
Estimates
For every estimated number in Recast, there is an uncertainty distribution attached to that number made up of 500 simulated draws (Bayesian posterior samples). For high-level summary numbers in the app, we summarize this simulation with the mean, or, where appropriate, a weighted mean (for example, if we are summarizing a channel’s ROI across the week we weight the daily ROI by the amount of spend on that day) unless otherwise noted. If the number does not specify “median” or some other descriptor, you can assume it’s a mean.
Confidence Intervals
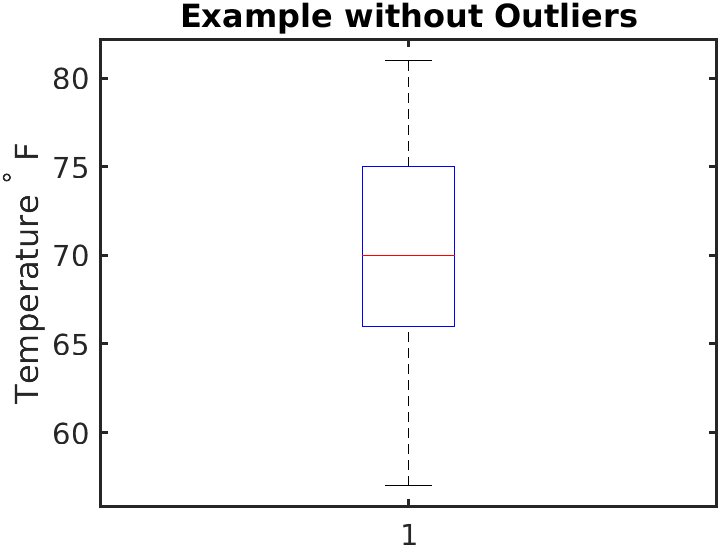
For confidence intervals (or more technically, Bayesian credible intervals) we summarize the interquartile range (IQR) of the 500 simulated draws. This is the 25th and 75th percentile of the draws. You may have seen this range when you learned about box plots in grade school math, the IQR makes up the “box” portion of the boxplot:

If no confidence level is listed, you can assume it’s using this 50% IQR confidence interval. Any departure from that will be mentioned in a legend or label.

In tables and downloads, we may summarize these posterior distributions using percentiles. If you see “25%” it is referring to the 25th percentile of the distribution, “50%” refers to the median or 50th percentile, etc. We always provide the 25th and 75th and may provide additional percentiles where helpful.
Plots

In plots our basic standards are to:
-
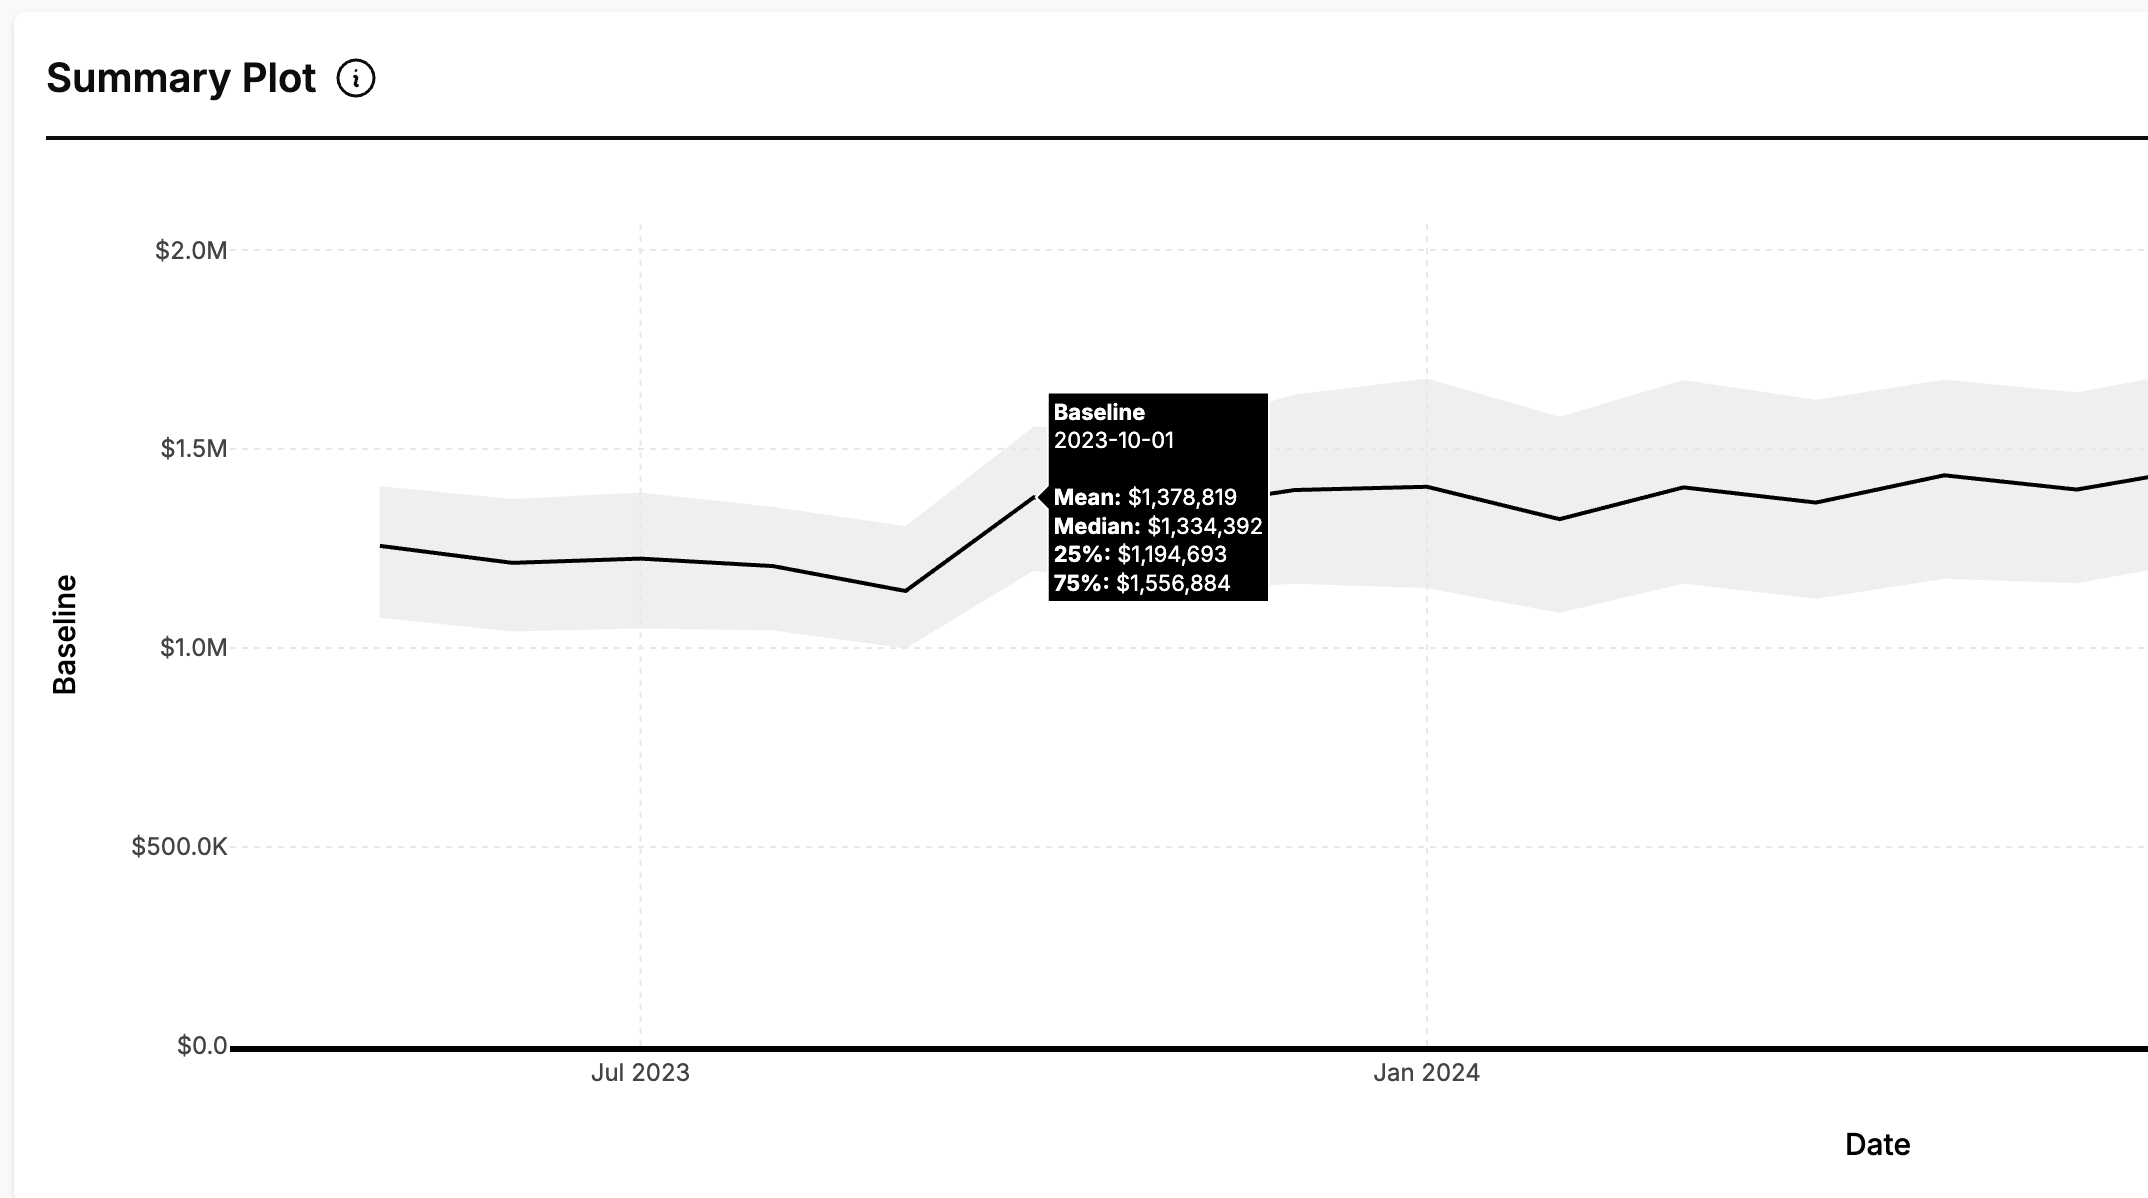
Show the median estimate as a dark line
-
Show the IQR as a lighter ribbon
-
Include the mean, median, and IQR in the hoverover
The one exception to that is waterfall plots, where individual estimates “add up” to some bigger whole. In these plots we (a) don’t show confidence intervals, and (b) use the mean instead of the median. For a better understanding of why we prefer the mean on plots that “add up” please see the next section.
Why does Recast show the mean but plot the median?
A natural question for us is why we are inconsistent between our topline numbers (where we show means) and our plots (where we use medians). Shouldn’t we use the same thing?
We prefer the mean as a summary statistic because it is easier to do math with. Suppose I have the mean impact for each day of the week for a channel, and I want the mean weekly impact. We can just do:

If we instead use the median, this is not true! The median of the week is not the sum of the medians of the individual days:

This works for the mean, but not the median, because the mean is a linear function, whereas the median is not! Linearity is a nice property to have because it allows us to compute the values of means of functions using only the means of the inputs.
Conversely, the median is often better behaved for plotting. As already mentioned, the confidence intervals we show (the IQR) are percentile based (25th and 75th percentiles), the median is also percentile based (50th percentile) so it has the nice property of always being within the confidence interval. Because the mean is more affected by outliers, in rare, extreme cases the mean can lay outside the IQR, which makes for messy, unintuitive plots.
In all cases we make the mean and median available in the hoverover so that you can assess the differences. Large differences are the result of skewed distributions where most of the data is toward one value, with some extreme values in the other direction.
So which should I use? The important point to make here is that neither is the “right” number. The only “right” answer is the full distribution with the confidence intervals, and we strongly encourage you to use those in your reporting.
In general, choosing a style and sticking with it will produce less problems than inconsistently switching back and forth. If the stakeholders are going to dig in and manipulate the numbers themselves, mean is likely the way to go for all the reasons listed above. If you primarily need to show numbers visually in presentation, median might work better for you.
Defining ROI/CPA
If we label something as “ROI” we are referring to the average, incremental, non-time bound performance of that spend:
-
Average means that it is the total expected incremental return divided by the total spend
-
Incremental means that it is an estimate of the difference between “what was observed” and “what would have happened if the money had never been spent”
-
Non-time bound means that it is the full expected effect of the spend, even if some of the spend is expected in the future (due to adstocking effects).
mROI is similar except that instead of average effect it is the estimated incremental return of the last dollar spent.
CPA and mCPA are similarly defined except calculated as spend over estimated incremental conversions.
Total and Direct
Frequently throughout the app, you’ll see a toggle to “include lower funnel effects.” This change both ROI/CPA estimates and Impact estimates between “direct effects” and “total effects”:

-
Total Impact considers the impact of the spend in the upper funnel channel and the additional impact from the lower funnel channel that was driven by the upper funnel channel. Total ROI is the total impact divided by the spend in the upper funnel channel plus the estimated spend in the lower funnel channel caused by the upper funnel channel.
-
Direct impact/ROI reports the upper funnel effects only, ignoring any lower funnel impact

Checking the “include lower funnel effects” toggle will report the total ROI/CPAs while unchecking it will report the direct ROI/CPA.
In other places in the app we are explicit about which ROI/CPA we are using.
The total vs. direct ROI distinction is only meaningful on the individual channel level. When talking about paid ROI or overall ROI for a marketing program, there is no distinction to be made as the calculation automatically includes both upper funnel and lower funnel channels.
Other ROIs/CPAs
In other places in the app, we will report various other definitions of ROI/CPA with the following modifiers on the labels:
-
Blended ROI - this is the total revenue divided by the total spend over a particular time period. It is not estimated, but observed from the data (if making a forecast we can calculate the expected Blended ROI).
-
Paid ROI - this is an estimate of the total effect of paid marketing divided by paid spend over a period.
-
Earned ROI - this is earned outcome divided by total spend (see below for how earned outcome is defined). Earned ROI applies only to holistic marketing performance, not individual channels.
Finally there are two additional labels we use for different types of “in-period ROIs”:
-
Observed ROI is the shifted impact attributed to the channel (or channels) in a time period, divided by spend in the time period.
-
Time Window ROI is the ROI if all impact after the end date of the time period is assumed to be zero. It is calculated as the shifted impact of the spend in the time period, divided by the spend in the time period. It will always be less than or equal to the “Observed ROI.”
Defining Impact
In the app you will see us refer to unshifted impact and shifted impact. This refers to the incremental effect of some marketing effort.
-
Unshifted Impact, or just “Impact” is the complete effect on the KPI produced by the spend on a channel (or group of channels) during the selected period (eg. a day). This includes spend where the effect is realized after the selected period (Impact that is realized in the days following the day on which the spent occurred).
-
Shifted Impact is the estimated effect on the KPI during the time period caused by spend on or before that time period. For example, a large mail drop at the start of the month will produce small daily shifted impact throughout the month.
Defining Earned Outcome
Earned outcome or earned KPI is a summary of what the business will obtain because of actions taken over a particular time period. It is the sum of:
-
Intercept during the time period
-
Spike effects during the time period
-
Unshifted impacts during the time period.
Earned outcome is used in relation to the Optimizer where we summarize what the business “earned” even though we don’t forecast when it will actually be realized.
Defining Baseline
The baseline outcome is the amount of KPI we expect independent of marketing spend (sometimes referred to as ‘organic’). When unspecified this does not include the impact of spikes. When your baseline outcome includes spike effects this will be labeled as so.
KPIs
Each Recast Insights dashboard shows the results for a particular KPI we are modeling. If you have more than one Recast model, you have the option to set up aggregate KPIs that are shown in an aggregate dashboard.
The other planning tools are not scoped to a particular KPI, although you will have the option to select one or more KPIs you want to use.
Each KPI may have a different date though which data is available depending on the data provided to the underlying models. The date on which Forecasts begin or actual results are reported through are often determined by this date through which data is available.