
The All Channels page in Insights combines information on your KPI and efficiency as they vary with spend over time, the saturation and time shift plots for all your channels as well as a summary of the spend driven by each of your upper funnel channels to the lower funnel.
This page serves as a snapshot view and allows you to compare spend, saturation, timeshifts and driving rate across your channels.
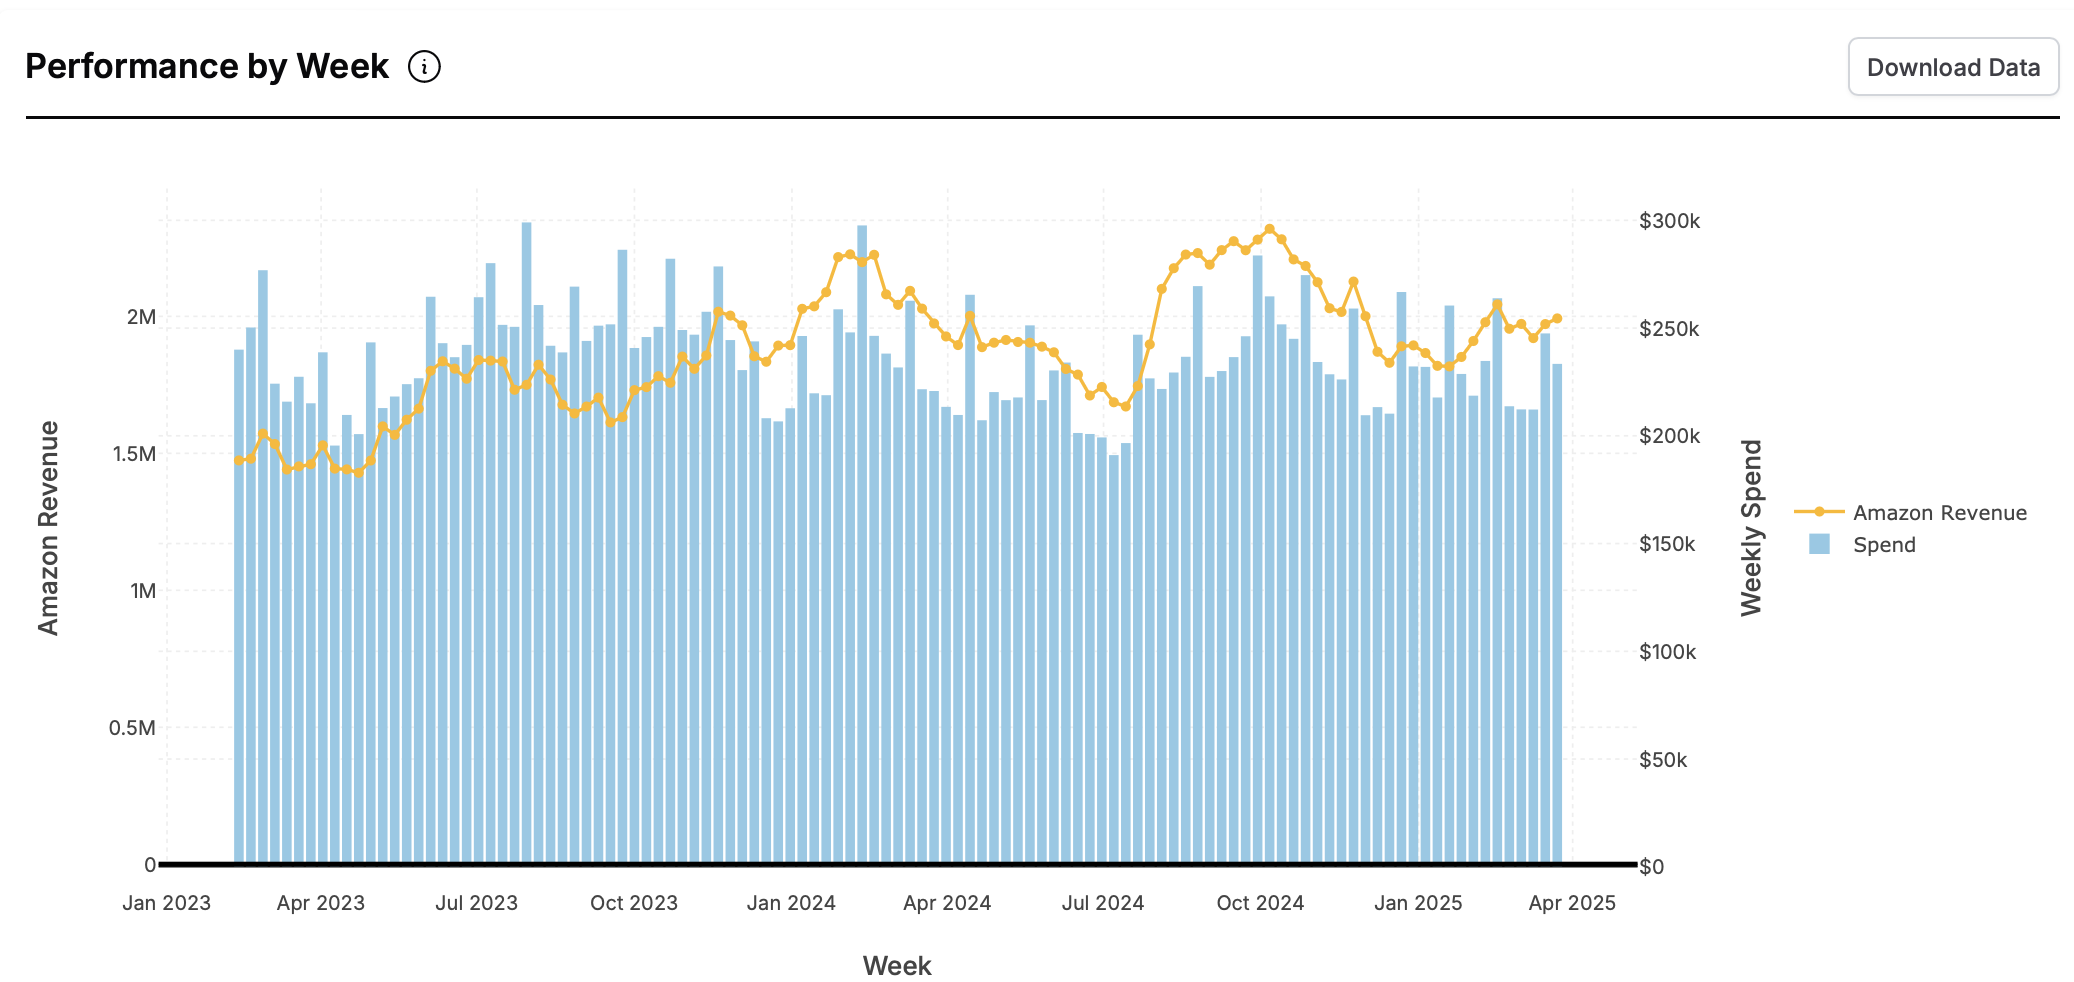
Performance per Week/Month
This plot shows the spend per week/month along with the total KPI gained each period over time.
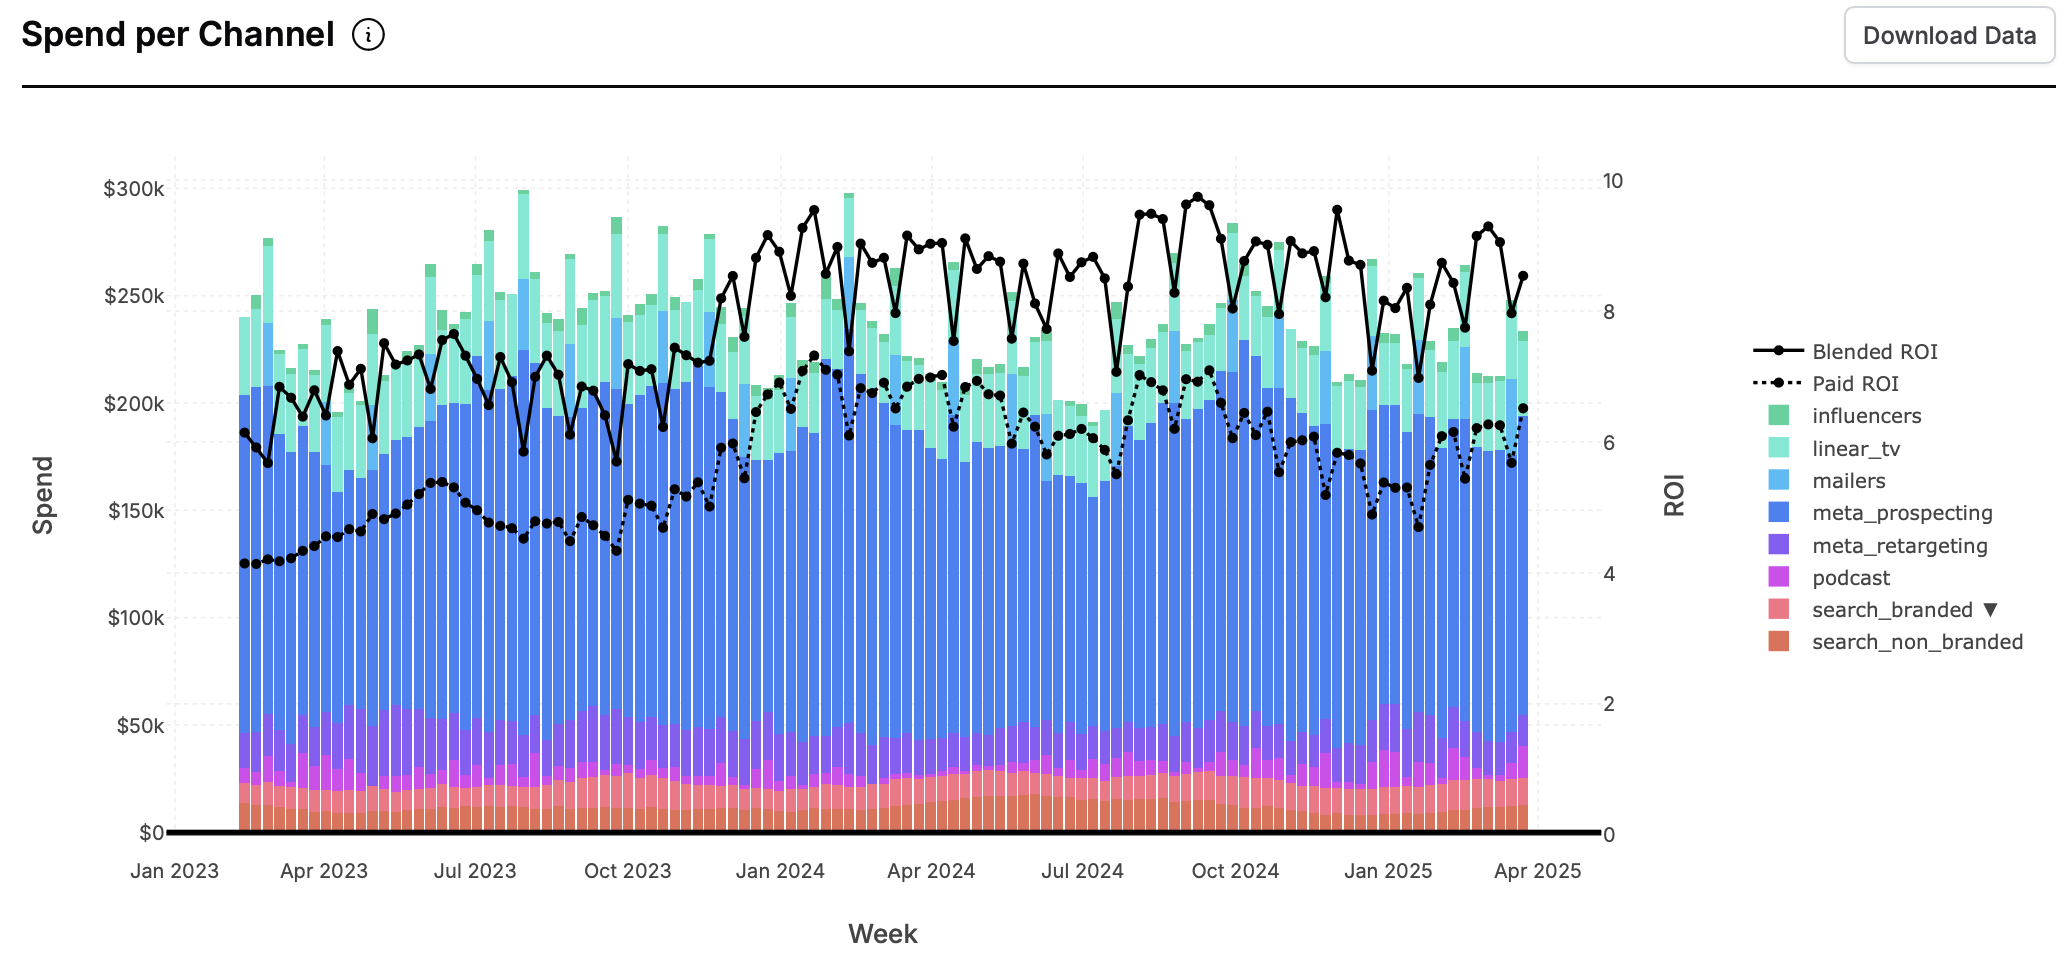
Spend per Channel
This plot shows the spend in each channel per week/month along with the blended and paid ROI/CPA calculated for each period over time.
Saturation by Channel
Saturation curves show how Recast expects the ROI of a channel to change at different levels of spend. Sometimes these are referred to as “diminishing marginal returns” curves. The Saturation by Channel plot shows the saturation curves for all of your channels on a single plot so you can compare returns at different levels of spend for each of your channels.
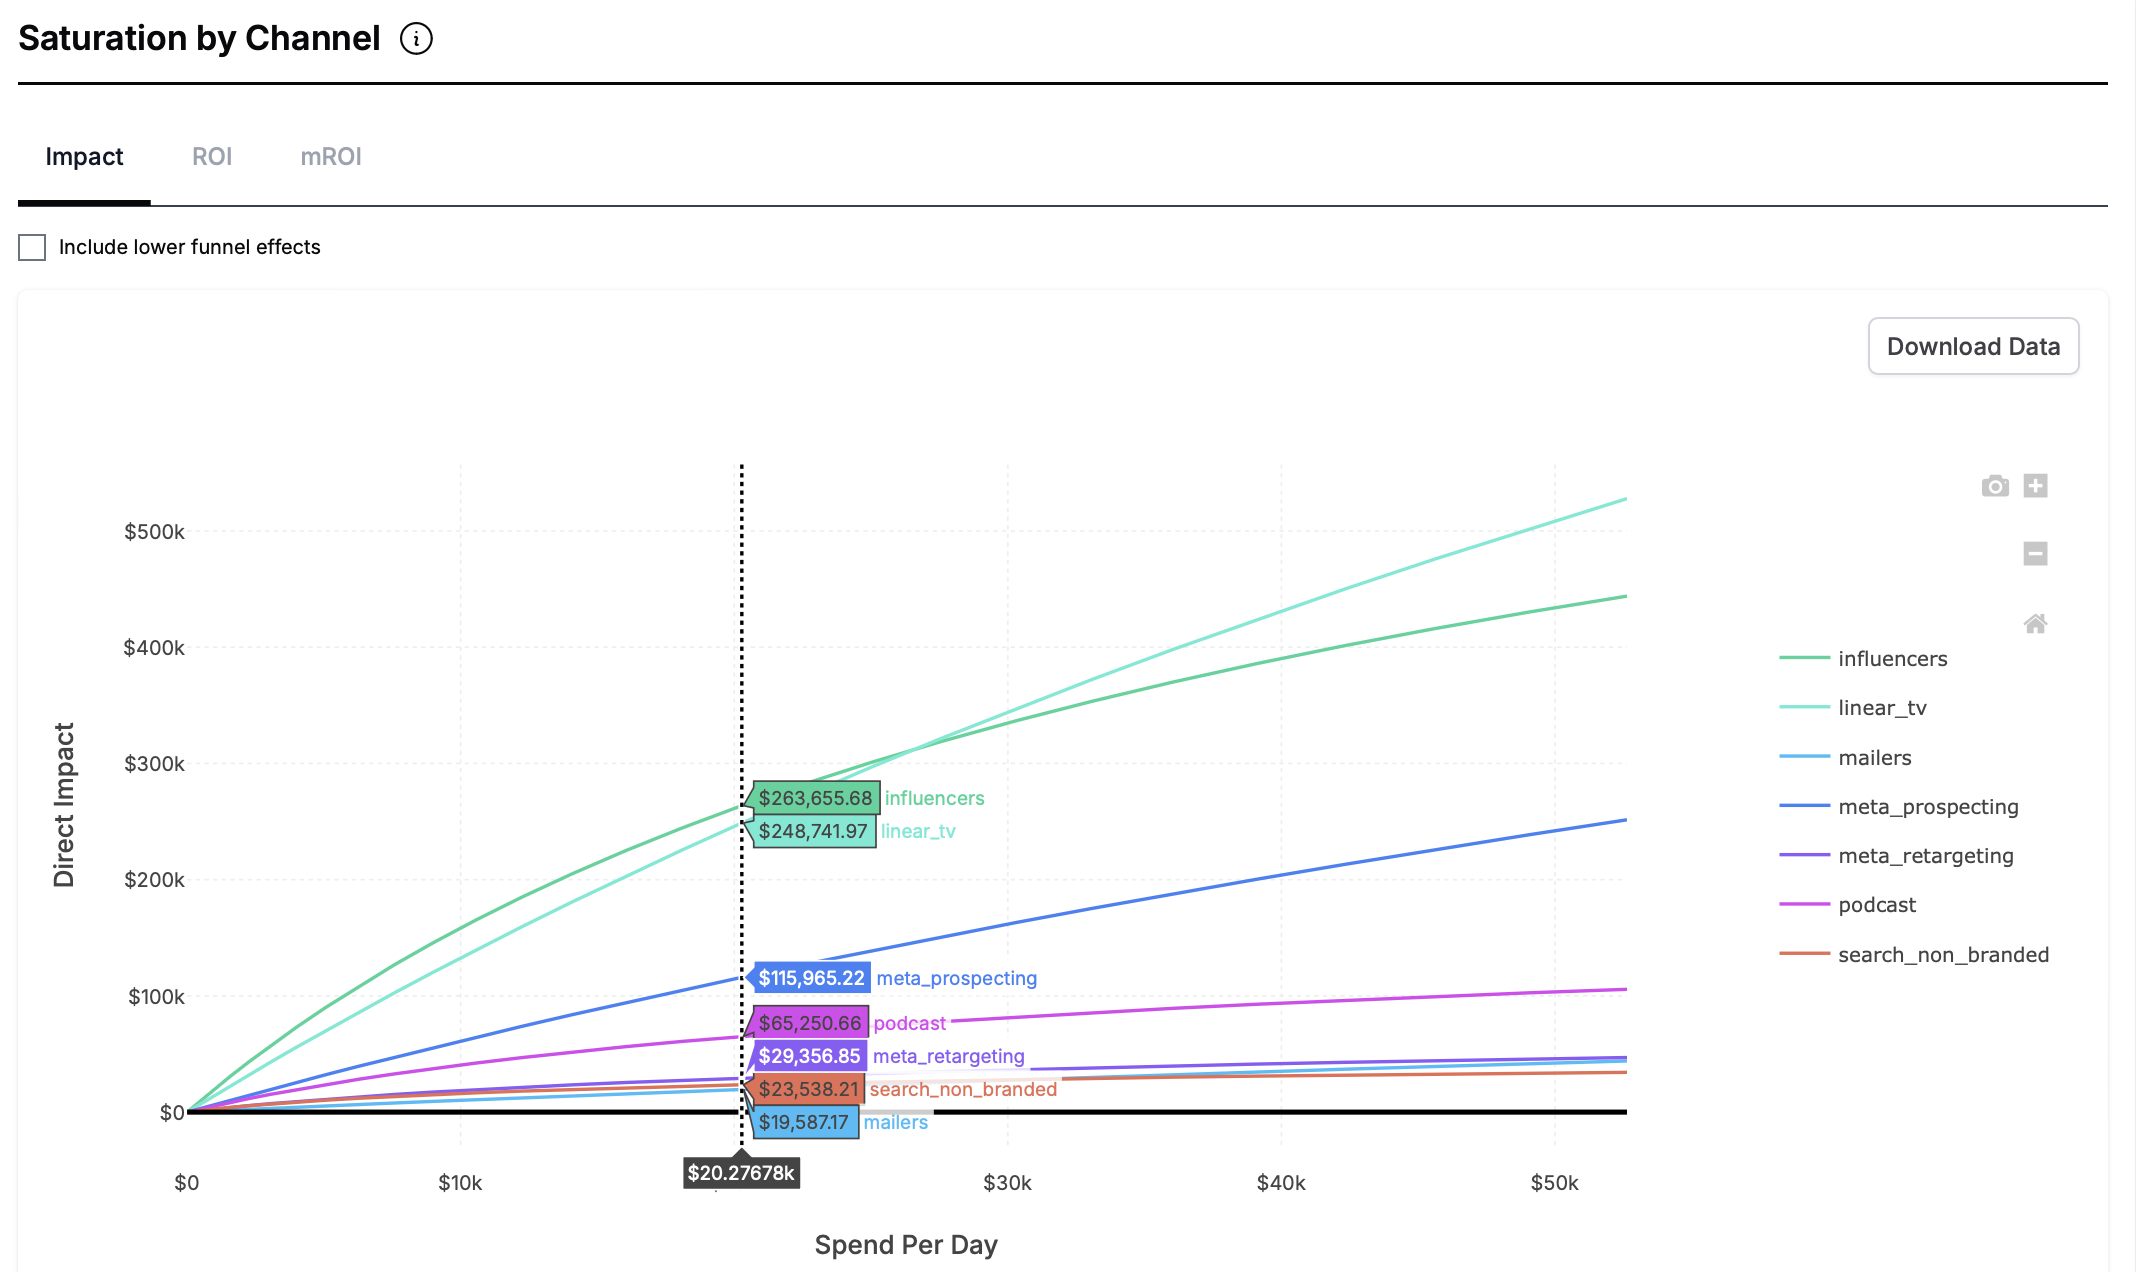
This plot shows the saturation if the entire value of the x-axis was spent on a single day. For the default plot in the dashboard, it uses the efficiency estimated on the last day of data available to the model. The date used can be changed using the Reporter.
Time Shift by Channel
Shift curves show how long it takes for marketing to have its effect. Sometimes people use the term “adstock” which is technically a different functional form then what Recast uses but the idea is the same: the model is learning how long it takes for marketing spend to have its effect.
How to interpret the chart:
-
The horizontal axis is the number of days since the spend occurred
-
The vertical axis shows the percent of effect realized after N number of days since the spend occurred.
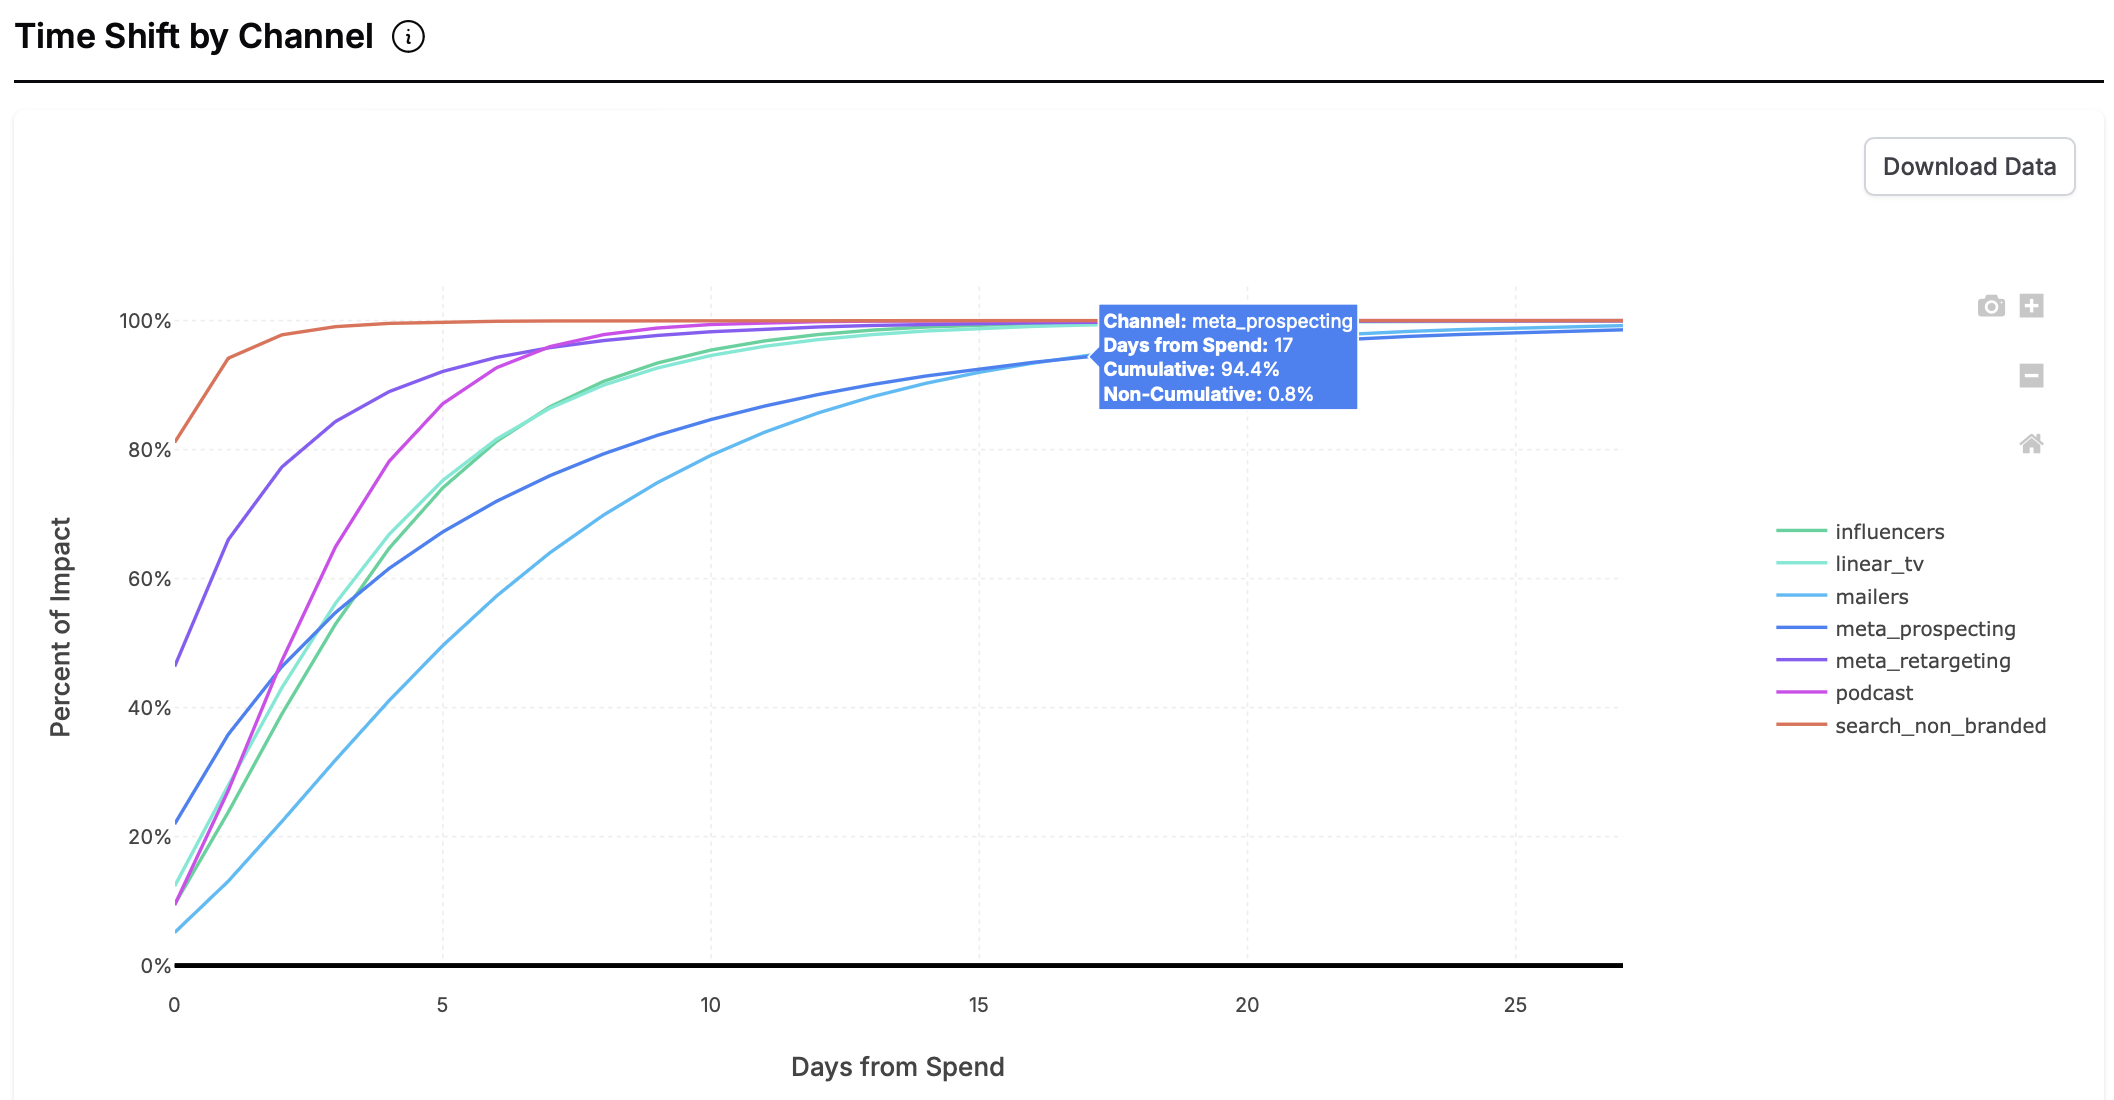
This plot shows all the channels on a single plot so you can compare which channels have the quickest/most delayed effect.
Drivers of Lower Funnel Spend
The Drivers of Lower Funnel Spend section shows how your spend in certain marketing channels drives spend into your lower funnel channels.
This section has a tab for each lower funnel channel and shows a waterfall chart of what other marketing channels drove that spend. That is, it answers questions like “how much of our google branded search spend was driven by TV spend?”
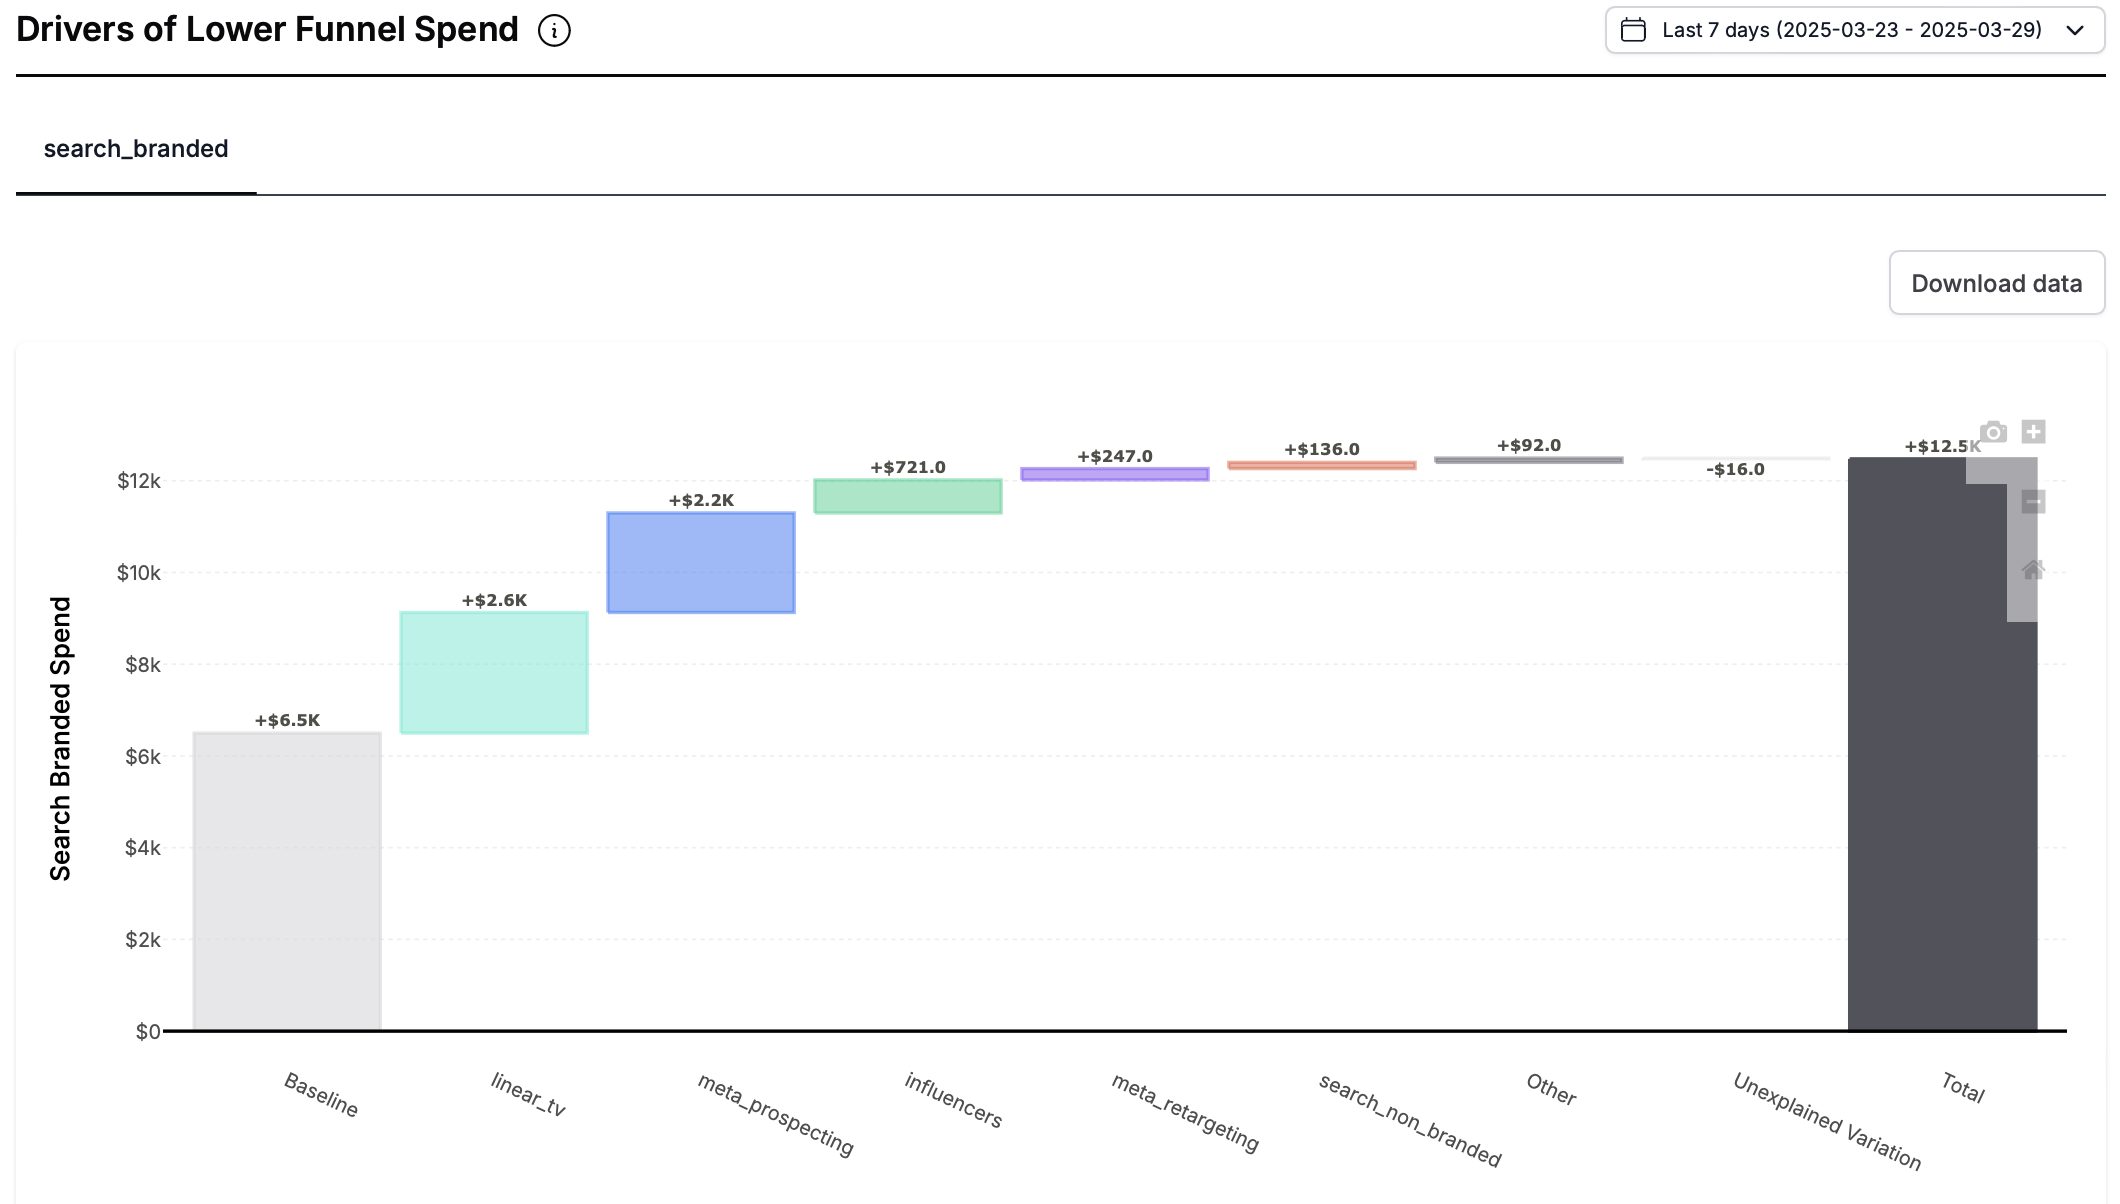
The waterfall plots also include a baseline which is an estimate of the spend in that channel not driven by other marketing channels.
Downloads
The Spend summary downloads show the spend in each channel per the selected period along with the ROI, MROI and Impact driven by each channel.