Calculating Uncertainty and Standard Errors for Lift Tests
Revenue Lift Tests
Revenue lift tests measure how much additional revenue was driven by the tested advertising, then use that to estimate the marketing’s ROI.
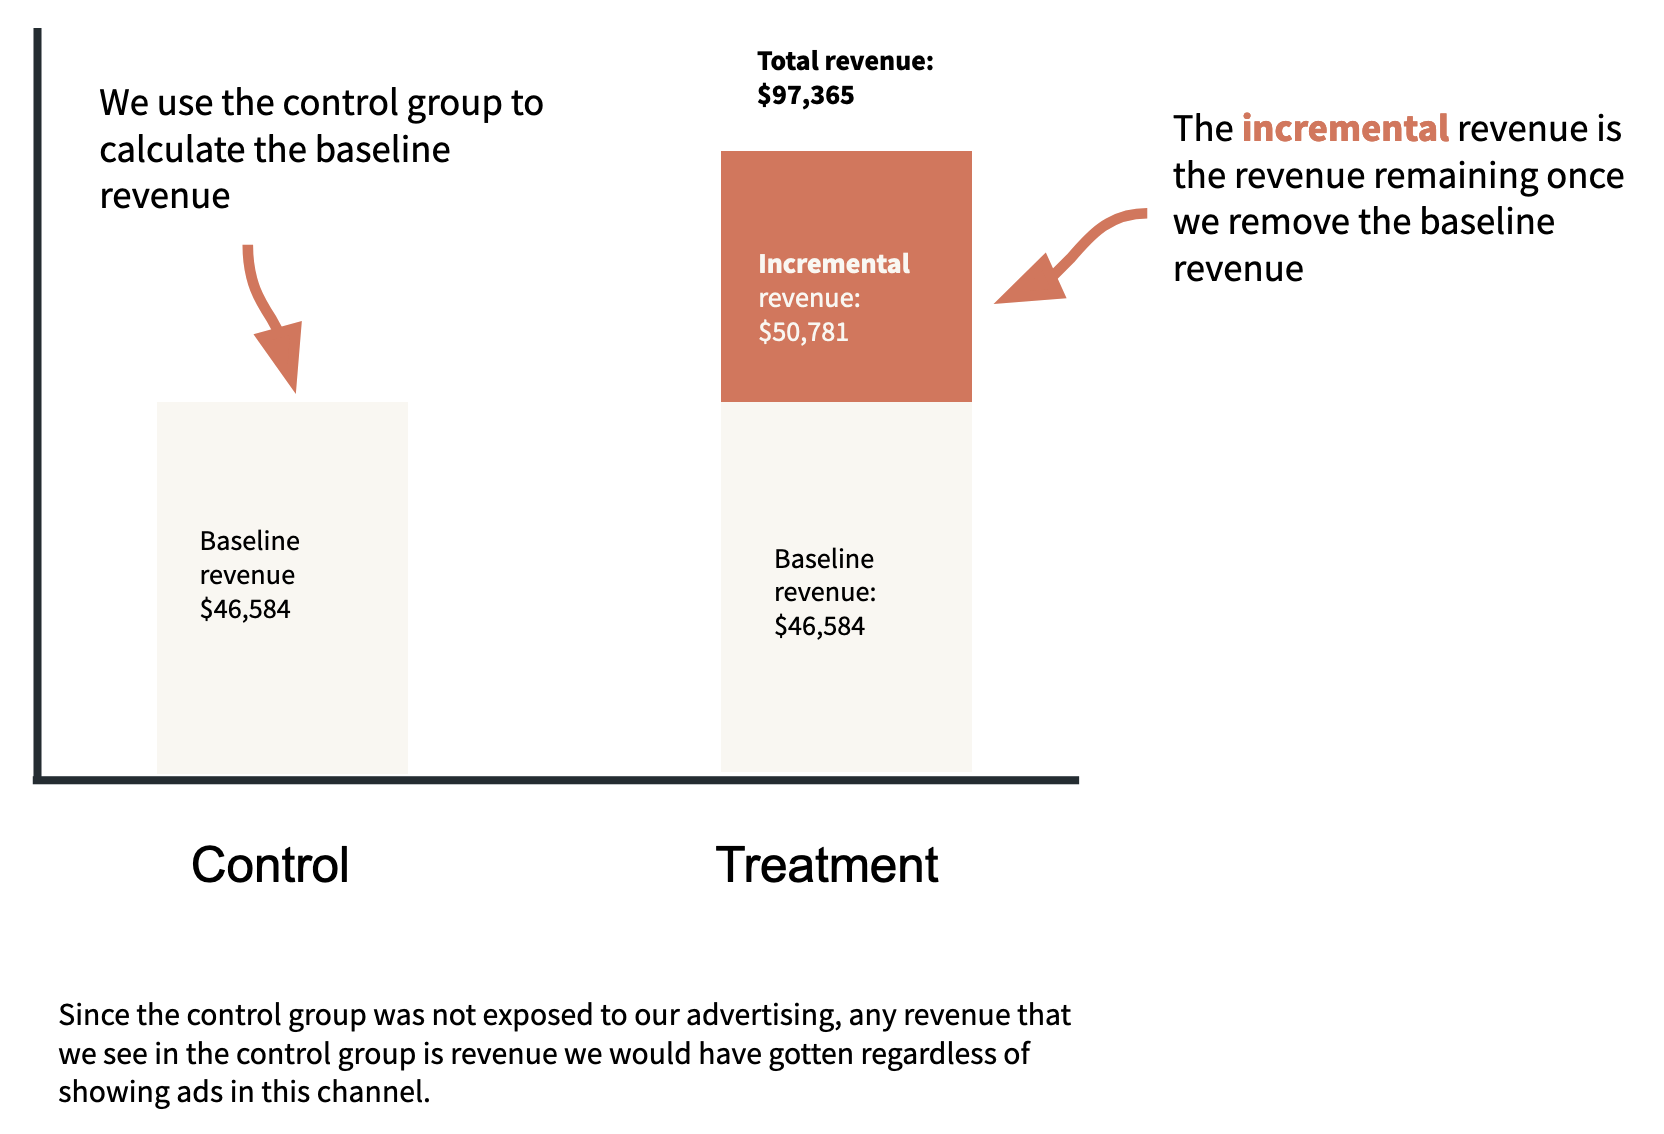
A control group that wasn’t exposed to the tested advertising can be used to estimate how much baseline revenue would have come from the exposed group had they not been exposed to the tested advertising. We attribute the remaining revenue to the advertising.
Calculating the ROI point estimate
A client gave us this information about a lift test they ran:
Exposed group
Unique Impressions: 9.2 million
Revenue: $97,365
Ad spend: $80,550
Control group
Unique Impressions: 3.7 million
Revenue: $18,735
We estimate the baseline revenue—the revenue that wasn’t driven by the tested advertising—in the exposed group by taking the revenue received from the control group and scaling that based on the relative sizes of each group. For example, if the exposed group was twice as large as the control group, we would expect twice as much baseline revenue in the exposed group compared to the control group.
By this logic, we estimate that there was
$18,735 x (9.2 / 3.7) = $46,584
of baseline revenue in the exposed group, and therefore
$97,365 - $46,584 = $50,781
of incremental revenue in the exposed group—revenue that we attribute to the tested advertising.
Dividing the incremental revenue by the ad spend gives the point estimate for the incremental ROI:
$50,781 / $80,550 = 0.63.
Calculating the ROI standard error
Clients will rarely be able to provide enough information about a revenue lift test to calculate a standard error for the ROI.
When we have had enough information to estimate the standard error, we have often found it to be between 5% and 15% of the ROI point estimate. So without any better information it’s reasonable to use a standard error of 10% or 15% when inserting the lift test into the model.
So when can we estimate the standard error? Ultimately we need some idea of the variance of the revenue.
For one lift test, a client actually gave us the granular per-order data. From this data we could get the population sizes, the numbers of orders, the average order values, and the standard deviations of order values for the control and exposed groups. We made a calculator to put all this info together to get the ROI standard error.
Technical details of the calculator
Here we’ll derive the formulas in the calculator for the standard errors for the revenues.
Our model for purchases is that the revenue for each purchase X(i) is drawn from a distribution with mean μ and standard deviation σ, and that that the number of purchases n follows a Poisson distribution with parameter λ.
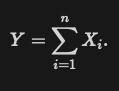
If Y is the total revenue, then
It follows from the central limit theorem that approximately

Then, by the law of total variation,
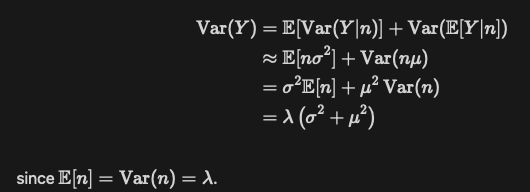
Next we just substitute the estimates for λ, μ, and σ:
- for λ, use the number of orders,
- for μ, use the average order value, and
- for σ, use the standard deviation of the order values.
We calculate the control group and the exposed group standard deviations separately like this, then scale the control group’s standard deviation by the ratio of the two groups’ populations to get the standard deviation of the scaled control revenue.
Finally, the scaled control revenue is subtracted from the exposed revenue to get the point estimate for the incremental revenue, and their variances are added to get the variance of the incremental revenue. Then just divide the point estimate and standard deviation for the incremental revenue by the ad spend to get the point estimate and standard deviation of the incremental ROI.
ROI lift test priors in Recast’s airtable
When we add an ROI lift test in airtable, we include a mean ROI (point_estimate) and a standard error (roi_std_err).
The model then applies a prior to the channel’s ROI of the form
normal(point_estimate, roi_std_err)
Conversion Lift Tests
Conversion lift tests measure how many additional conversions were driven by the tested marketing, then use that to estimate the marketing’s CPA.
Calculating the CPA point estimate
Calculating the CPA point estimate basically follows the same logic as calculating the ROI point estimate.
A client gave us this information about a lift test they ran:
Exposed group
Population: 458,912
Conversions: 4,278
Ad spend: $225,432
Control group
Population: 15,000
Conversions: 72
We estimate the baseline conversions in the exposed group by scaling the conversions from the control group based on the relative population sizes. So we estimate that there were
72 x 458,912 / 15,000 = 2,203
baseline conversions in the exposed group. The remaining
4,278 - 2,203 = 2,075
conversions are incremental and attributed to the advertising.
The incremental CPA point estimate is then
$225,432 / 2,075 = $108.64
Calculating the CPA standard error
Calculating a standard error for the CPA is much simpler than for the ROI, since the only source of variation is the number of conversions. But there is a hack we’ll need to use at the end to get something that makes sense…
Suppose that the numbers of conversions in each group are Poisson distributed. Then the variances of the conversions in the exposed and control groups are 4,278 and 72, respectively.
The variance of the scaled control conversions is therefore
72 x (458,912 / 15,000)^2 = 67,392,
and so the standard deviation of the incremental conversions is
sqrt(67,392 + 4,278) = 267.7.
Now comes the hack.
The 68% interval for the ROI in terms of incremental conversions is
2,075/$225,432 ± 267.7/$225,432.
To get an estimate for the CPA standard error, we take the top end of this ROI interval, invert it to get the bottom end of the CPA interval, then subtract that from the CPA point estimate:
$108.64 - 1/(2,075/$225,432 + 267.7/$225,432) = $12.41
Here’s an R function that will do this calculation for you.
calc_cpa <- function(spend,
                     control_pop,
                     control_conversions,
                     exposed_pop,
                     exposed_conversions) {
  scaled_control_conversions <- control_conversions * exposed_pop / control_pop
  scaled_control_var <- control_conversions * (exposed_pop / control_pop)^2

  incremental_mean <- exposed_conversions - scaled_control_conversions
  incremental_se <- sqrt(exposed_conversions + scaled_control_var)

  cpa_mean <- spend/incremental_mean
  cpa_se <- cpa_mean - 1/(1/cpa_mean + incremental_se/spend)

  list(
    cpa = round(cpa_mean, 2),
    se = round(cpa_se, 2)
  )
}

calc_cpa(
  spend = 225432,
  control_pop = 15000,
  control_conversions = 72,
  exposed_pop = 458912,
  exposed_conversions = 4278
)
# $cpa
# [1] 108.63
#
# $se
# [1] 12.41
CPA lift test priors in Recast’s airtable
When we add a conversion (CPA) lift test in airtable, we include a mean CPA (point_estimate) and a standard error (cpa_std_err) with units in dollars.
The model then applies a prior to the channel’s ROI of the form
normal(1/point_estimate, roi_std_err)
where roi_std_err = 1/(point_estimate - cpa_std_err) - 1/point_estimate.
Calculating a CPA standard error from an asymmetric confidence interval
Clients will sometimes give us asymmetric confidence intervals for their lift tests. We need to convert those to a standard error for airtable.
If you invert all of the numbers then you may get a symmetric(ish) ROI confidence interval. This is good because the lift test priors we use are symmetric on the ROI scale.
For example, a client sent us test results with a CPA point estimate of $188 and an 80% confidence interval of ($150, $253). You can check that (1/253, 1/150) is roughly symmetric around 1/188.
The R function below converts the original asymmetric confidence interval into a standard error that gives an approximately correct symmetric distribution on the ROI scale after the 1/(mean - se) - 1/mean transformation is applied.
For the example above, we use it like this:
cpa_ci_to_se <- function(point_estimate, ci_width, lb, ub) {
  normal_quantile <- qnorm(0.5 + ci_width/2)

  se <- c(
    point_estimate * (point_estimate - lb)/(lb * normal_quantile + point_estimate - lb),
    point_estimate * (ub - point_estimate)/(ub * normal_quantile + ub - point_estimate)
  )

  # the SEs resulting from each bound might be different, so pool them
  sqrt(mean(se^2))
}

cpa_ci_to_se(
  point_estimate = 188,
  ci_width = 0.8,
  lb = 150,
  ub = 253
)
# 31.21283
So the standard error we should put in airtable is $31 for this lift test.
Updated 4 days ago