🔄 The Refresh Tracker
This refresh tracker page allows you to track the status of your model refresh, schedule a new refresh and see any reasons why your refresh might be failing.
This page contains:
- Data Quality Summary
- Latest Refresh Status
- Buttons to refresh your model, schedule your refresh and cancel your refresh
- Date ranges for model data
- Table of all historical revisions to channel spend identified
When you are onboarding with Recast, we will work with you to create a refresh schedule. This is a recurring day (eg. every second Tuesday) when we refresh your model. Every time your model refreshes, we incorporate all the new data since the last refresh and the model updates its estimations. Visit our data guide for more information on the formatting of the data we expect to ingest and the ways you can give Recast access to your data.
The refresh tracker allows you to track the status and any issues with your latest refresh. It also allows you to schedule a new refresh if your refresh has failed.
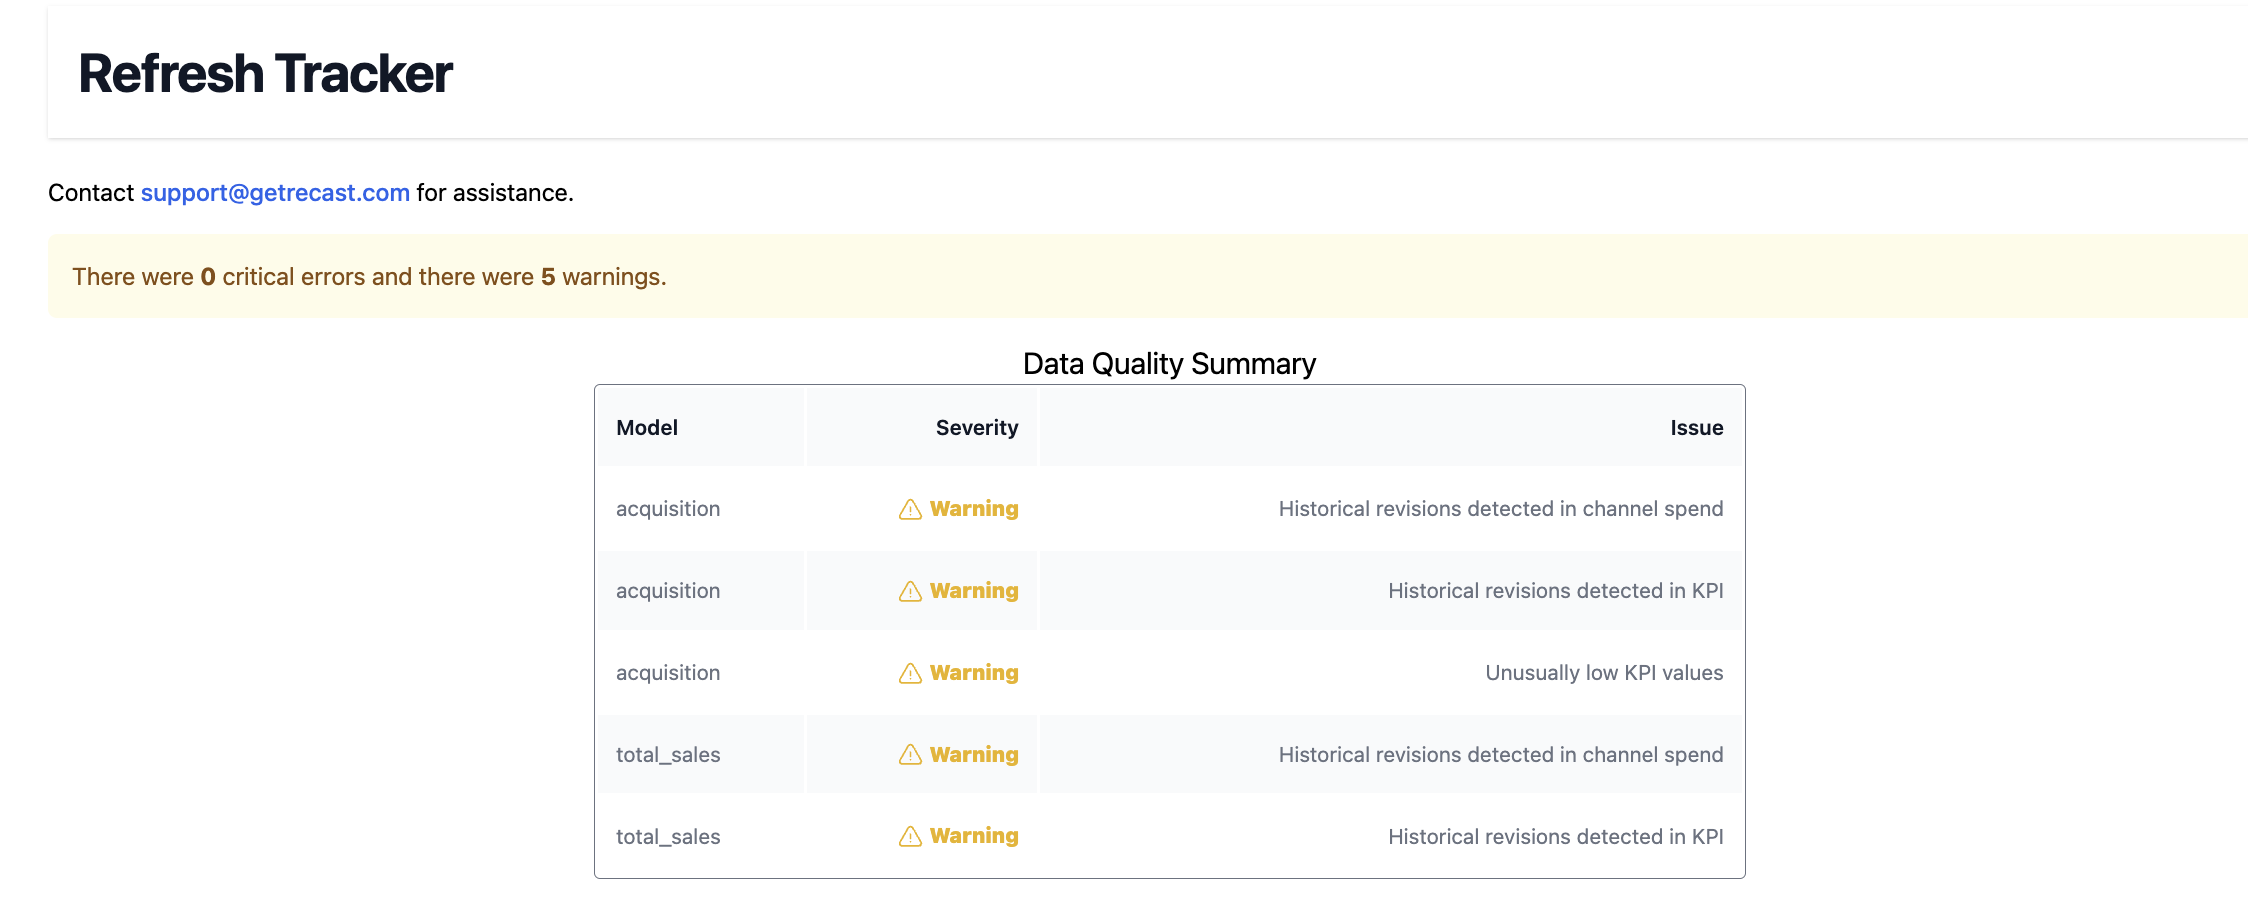
Data Quality Summary
The data quality summary is the first table at the top of the refresh tracker. This table shows you all the warnings and errors Recast received during your most recent refresh. It summarizes these across all your models, shows the severity of each notification (warnings do not cause a refresh to fail whereas errors do.) and describes the issues identified.
These warnings provide insight into the patterns in the data that may make it difficult for the model to provide the best results possible. Recast recommends you flag this with your internal point of contact for data to resolve any errors or warnings.
Some common issues and how to resolve them are:
Historical revisions in channel spend: This means that there were changes to the amount you reported to spend in a channel. Recast received spend data that when compared to a previous data set, was different. This could mean that we initially received incomplete data or that some of your data is missing.
Historical revisions in KPI: This means that with the new data ingest, there were changes to the KPI you reported compared to your previous data ingest. This could mean that we initially received incomplete data or that some of your data is missing. Ex. You reclassified how you report “returns” in your sales data, causing historical data to change
Unusually low KPI values: This means that the KPI we are modeling looks suspiciously low during the period of the new data. This could be because all your data wasn’t fully in. Ex. sales from Target were reported but sales from Walmart were missing.
Critical errors that will cause your refresh to fail include:
Missing data for certain dates
Duplicate dates detected
Recent data is not newer than historical data
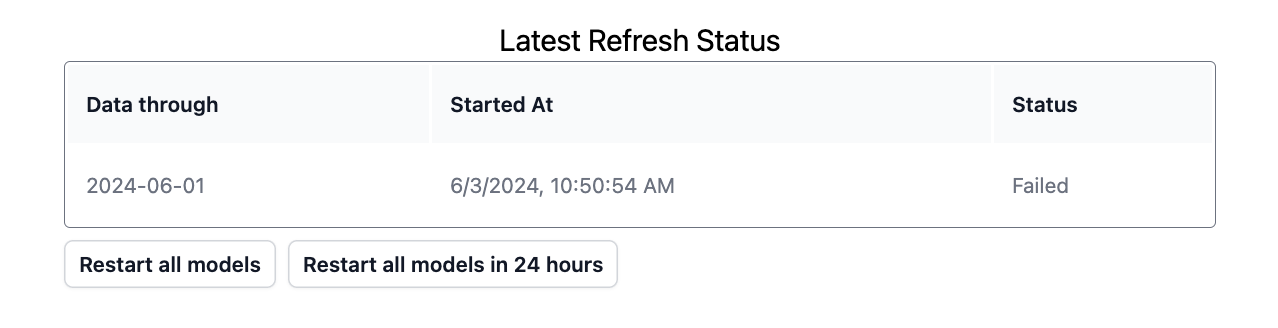
Latest Refresh Status
This box shows the status of your latest refresh. The statuses are:
Running - this means your model is currently updating
Aborted - this means that your model refresh was canceled as it was updating
Scheduled - this means it has been scheduled to start within the next 24 hours
Success - this means your model was successfully refreshed
Failed - this means that your model was not able to be refreshed.
Under this box, you will see options to cancel, restart a refresh, or schedule a refresh for tomorrow. If you have gotten any data quality errors, you can schedule your refresh to begin in 24 hrs during which you can update the data that Recast receives to correct the errors. If your updated data is ready, you can use the restart button to re-run your model refresh.
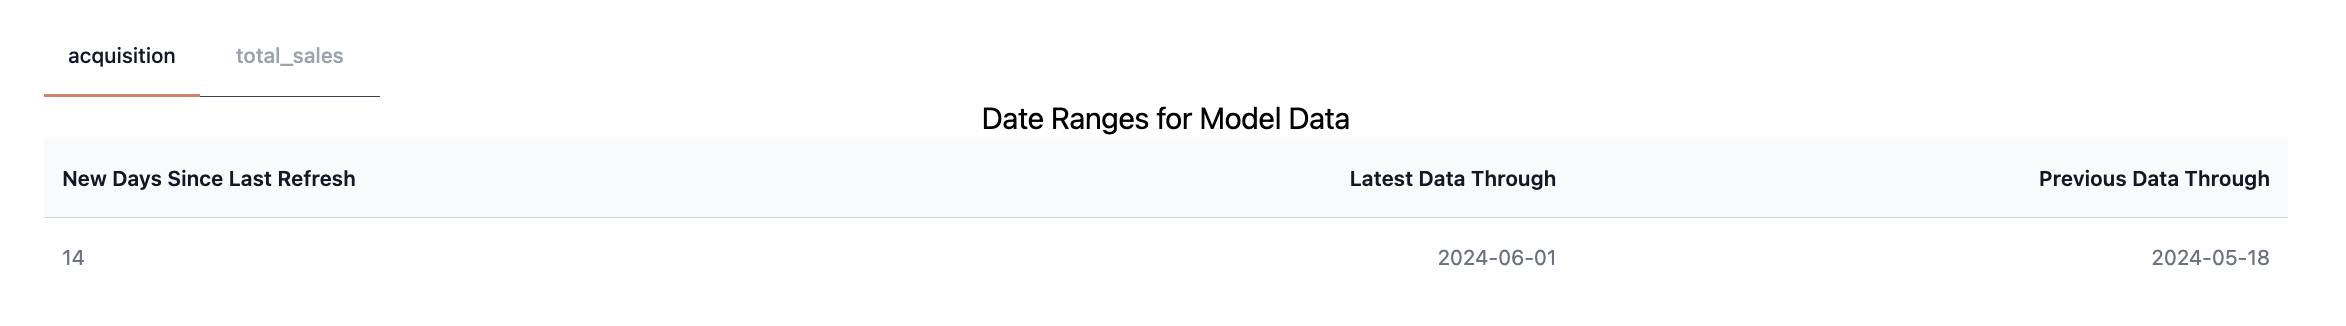
Date Ranges for Model Data
This box shows you a breakdown of when the data was last refreshed, what date the current refresh's data is through, and what date the prior refresh's data was through. You can use this to check that your model will be updated through the day you expect.
Using the tabs you can toggle between these dates for each of your models.
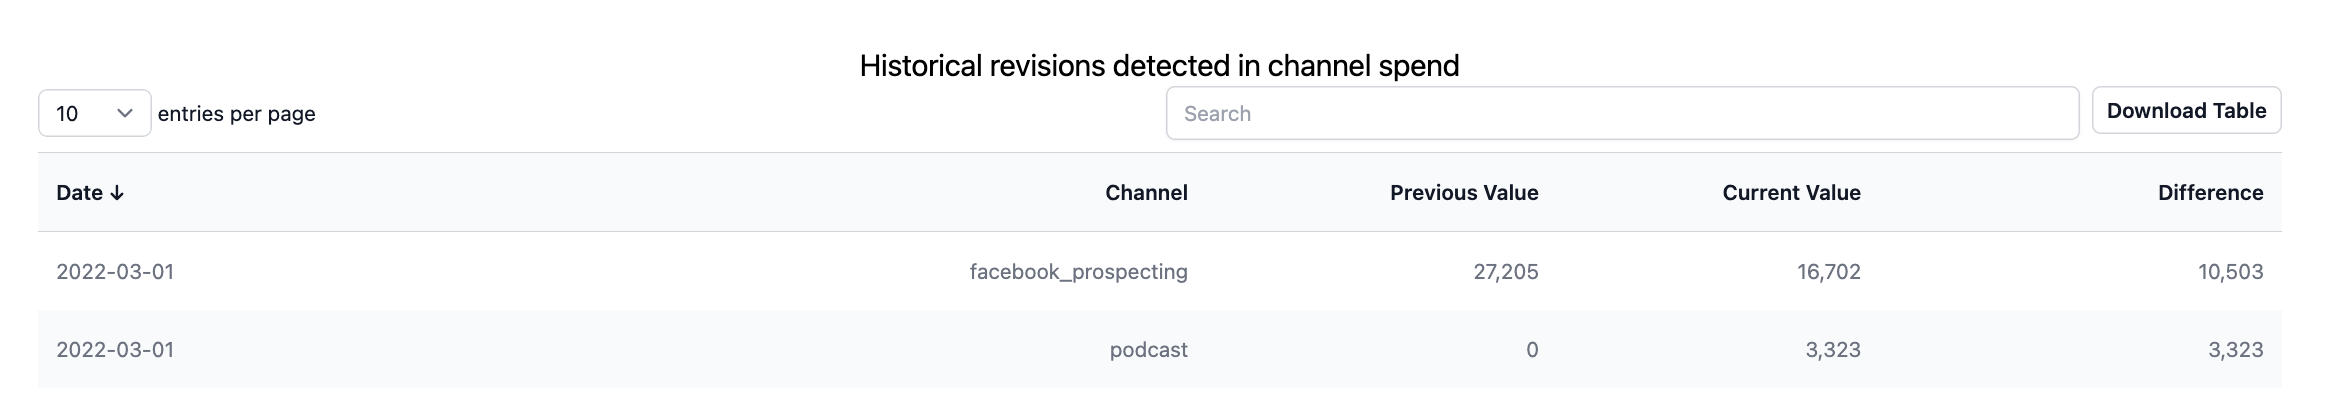
Historical revisions detected
Finally, you can see a table of all the revisions in channel spend and in KPI values detected in your most recent dataset that you provided for your most recent refresh. This table shows the date on which the data is different from the previous dataset, the channel for which spend was different, the previous spend reported, the currently reported spend and the difference between the two. This can help you identify what is causing the revisions in your data. The 'revisions in KPI' table shows the changes to your KPI, the model and the date.
Sometimes, the current data is correct. In this case, just keep an eye out for potential ways in which this could impact your previous forecasts or optimizations as these might have under or over predicted due to the previously incorrect data.
The data table will report ALL historical changes for reference, but only changes >$1000 trigger the warning.
How to resolve data issues:
Before you click the refresh button or schedule your refresh, make sure that your data does not have any data quality issues. Data quality issues can cause model instability. To check for any issues:
- Check the problematic data points indicated in the table
- Check to make sure you uploaded a complete dataset
- Dig into why you may be seeing historical revisions by looking for data entry errors or delays in when data comes from your vendors.
Updated 6 months ago