🏁 Getting Started
Initial Set Up
When you join as a Partner of Recast, Recast will set up three things:
- A Partner account — this will allow you and your team to log in to the Admin side of Recast, launch runs, view results, and manage your clients’ models.
- Client account(s) - We will create client accounts for each of your clients, which will allow them to see their own models. Once the client account is created, you can add specific user logins so that your clients can set passwords and use the app
- Client Dashboard(s) - Each client model will be attached to the dashboard
Some helpful terminology:
- Client - The organization that acts as the consumer of the Recast app
- User - A specific login of an individual that is part of a client
- Dashboard - the set of tools used to explore model results, including the Insights, Forecaster, Optimizer, and more. Dashboards are organized around a single modeled variable. Clients can have multiple dashboards, but only one model run is deployed at a time. Partners will be able to see dashboards for models that were run but not deployed.
- Model Run - A model run is a specific combination of priors, data, and code that results in model output that can be shown in the dashboard. A normal refresh cadence is to do one model run each week with updated data.
- Model - A loosely defined term to mean whatever modeling decisions have been paired with a specific KPI. We might say things like “we updated your model” but more precisely what we mean is “we did a new model run with 7 days of additional data included”
- KPI - The outcome variable we are modeling. This is the dependent variable in the model, we colloquially refer to this internally as the “depvar.” While we can tweak the how we define the variable, each dashboard is organized around having a central KPI.
Prepping Data for Recast
In order to launch a run, you’ll need to provide a csv of the dependent variable and marketing data. This csv should have the following attributes:
- One row per day, no missing days. The start and end dates are arbitrary; however, a “normal” dataset for us would consist of the past 27 months of data, with the last date being sometime in the last week.
- A header row with the following attributes:
- One column titled “date”
- All other columns with variable names (both marketing channels, contextual variables, KPIs). No capitalization, use underscores (not spaces) between words
- Rows should have the following attributes:
- The date column formatted yyyy-mm-dd
- All other columns should be numeric
- One column for every upper funnel, lower funnel, and contextual variable in your model
- No missing values
Colloquially, we refer to this as the “clean data.” You will upload this csv on the run launching page when launching a model.
Prior Setting
This Google Sheet provides a template for which to set model priors. Resources for how to interpret and set priors can be found here and will also be covered in training sessions with Recast. This page will walk through an example of how to format the text properly.
To prepare a brand new model, follow these steps:
- Make a copy of the above Google Sheet
- Share the sheet with [email protected], this is Recast’s bot account that will parse the sheet and pull the data into Recast. Failure to share the sheet with this account will cause errors when launching model runs.
- Add rows to fill out the sheet. Do not edit headers or columns.
To modify an existing model:
- Copy the existing model by clicking File → Make a Copy (Note: while you can modify existing sheets, we recommend the copy approach in order to maintain a version history of what previous models were run). Ensure to share the new copy with the same people.
- Add or modify the necessary rows in the file
Note: we will occasionally need to modify the document layout in order to release new functionality. The linked document above will be kept up to date with the latest supported layout.
Launching an Initial Run
To launch a run, log in to the Recast app using the operator sign in. From the Admin panel sidebar, select "Manage Runs" and click "Launch Run:"

Select the client you want to run the model for.
Copy and paste the Google Sheet priors URL (ensuring you’ve shared the sheet with the Recast bot).
Choose a csv with your clean data and upload it
Select a Run Type. The four types are:
- Normal Run - This is a generic estimation of the model that you would use for typical model updating.
- Parameter Recovery - In this type of run, Recast will first run a model that simulates results exclusively from the priors we’ve set for your model. Then, when that is finished Recast will take one of those simulations and use the simulated KPI as the true KPI and re-run the model in order to estimate if we can successfully recover the known parameters using the model’s estimation. This will result in a dashboard that shows how well various parameters were recovered.
- Holdout Run - This is a normal run, except some of the data will be trimmed off the end in order to do a true out-of-sample holdout test. A dashboard will be produced showing how well the predicted performance during the holdout time period aligned with the actual performance. You can specify how many days you want in the holdout set, e.g. “60, 120, 180” will launch three models, one with 60 days held out, one with 120 days held out, and one with 180.
- Stability Loop - This will run a series of models, each with a variable end date, spaced out from each other (usually by one week). The purpose of this run type is to simulate stability over time, to get an idea if the model will be stable as you refresh it week to week. The run comparison dashboards produced will show how much variability in the estimated quantities there were.
Recast will typically run the validation steps (2-4) while onboarding a new client to ensure a valid model, and then re-run them when making major model adjustments (splitting channels, changing the KPI, etc). More info about our validation process can be found here.
Viewing the results
Depending on the complexity of your models, models will take anywhere from 1.5-8 hours to run and generate results. Once a model is finished, click the model run on the "Manage Runs" page to see information like this:

The top of the page show various info about what went into the run (what priors/data were used, the type of run, the status). In the table below you get information about individual runs. The View Model button will take you to the dashboard and allow you to see the results exactly as your client will experience them. Important note: clients are not given immediate access to any model runs. In order to deploy the model to the client, the Activate Model button must be clicked. Additionally, the run also produces a "run_analysis" HTML document. The purpose of this document is to primarily compare this model to the model previously deployed to the end client. Information on interpreting this dashboard can be found on our Interpreting the Outputs page.
Dashboard Page
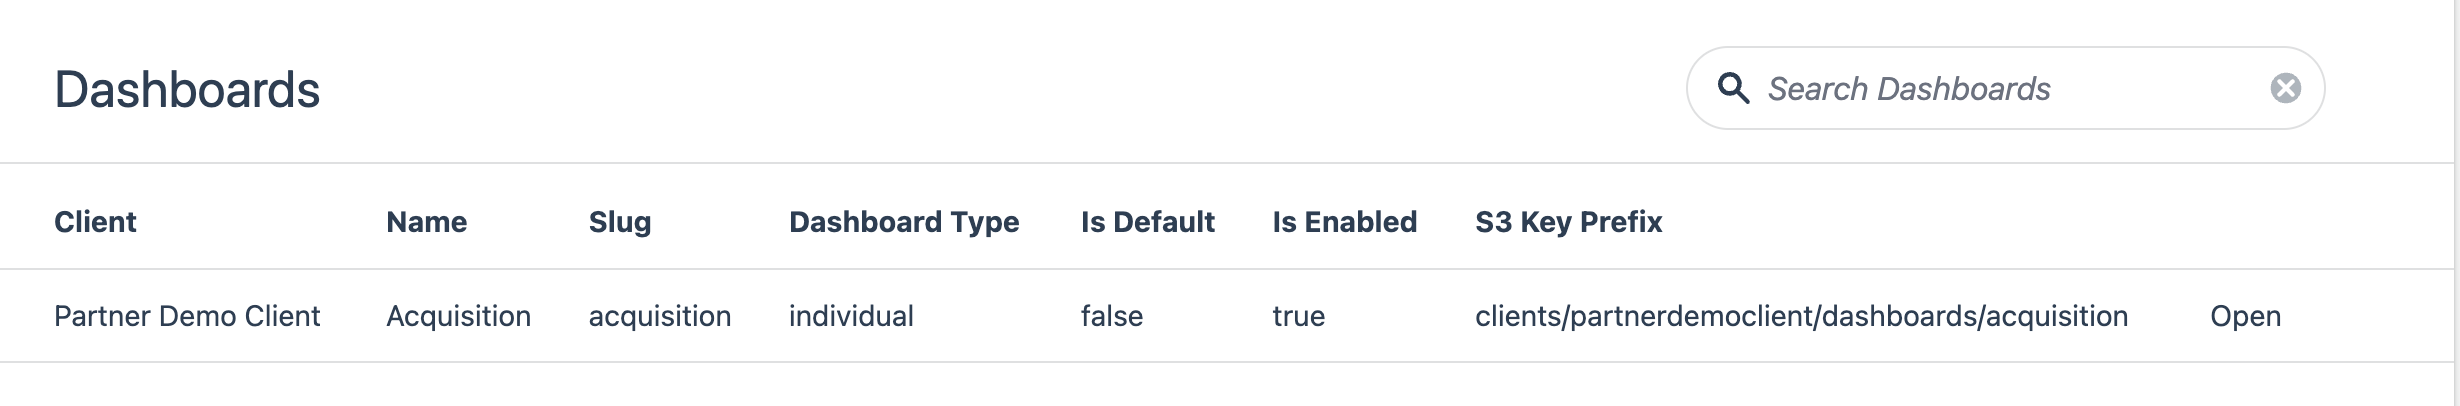
Recast will create a single dashboard for each KPI you're building. This dashboard can be thought of as a "landing zone" for the models you build. Note that until you start building models, these dashboards won't be functional and clicking "Open" will result in an error.
Updated 2 months ago