Spike placement and grouping can often have a large impact on model fit, stability, forecasting power, and channel estimates. So… everything. It’s worth thinking through your spike configuration carefully.
Theory
Additive spikes are an additive term in our regression equation:
depvar = intercept + marketing + additive spikes
Their precise definition can be found in the Recast Model Technical Documentation.
You can think of additive spikes as being part of the intercept in the sense that they capture some dependent variable (depvar) variation that isn’t explained by marketing.
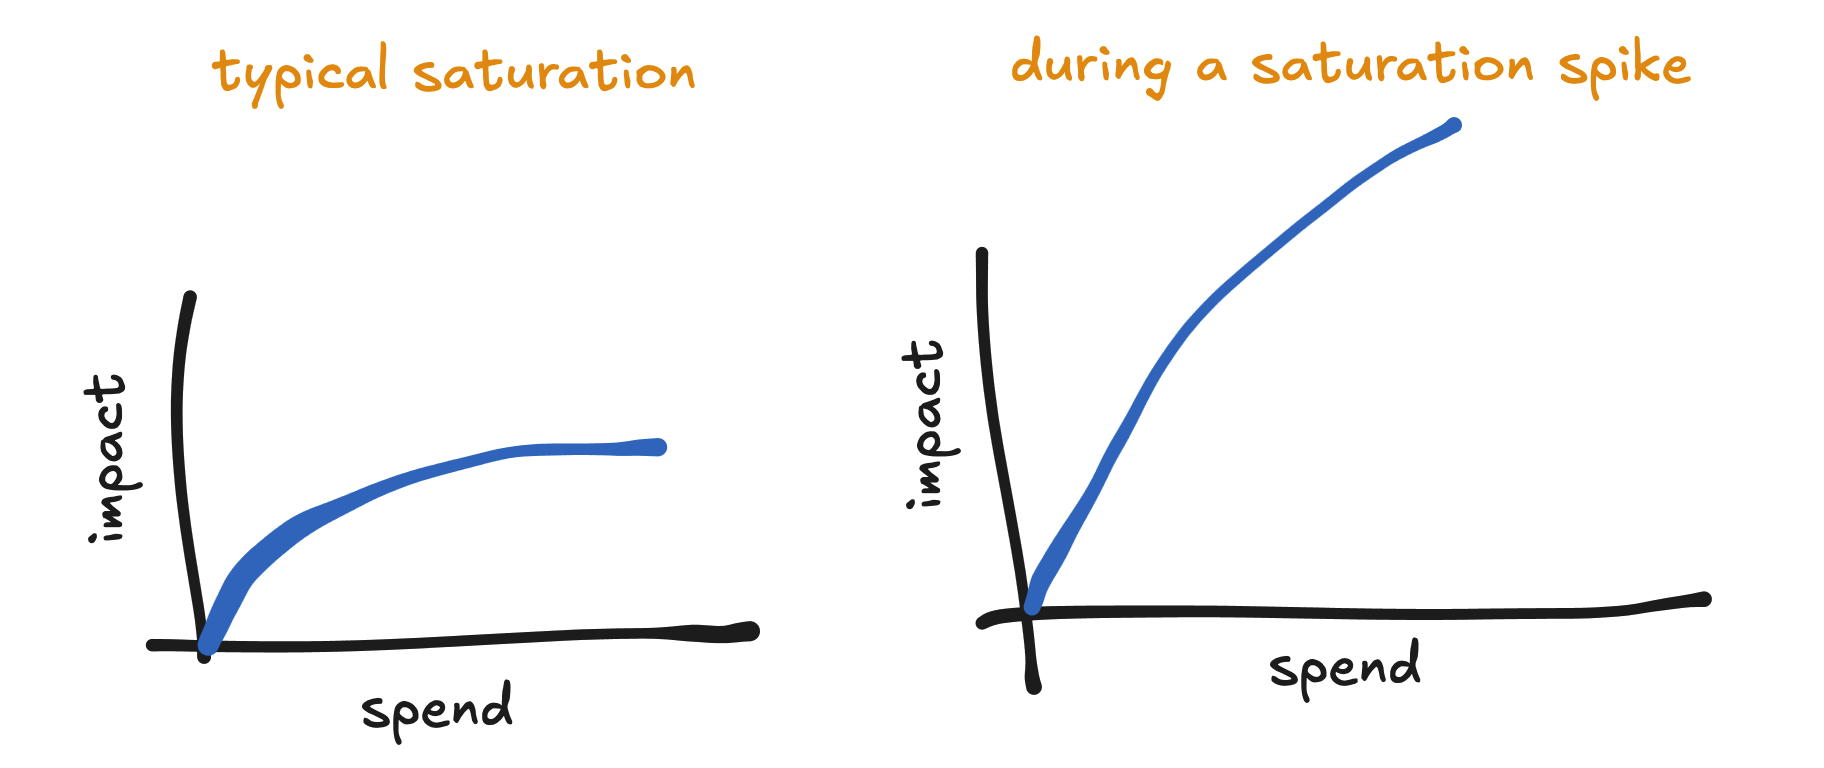
Saturation spikes, on the other hand, are wrapped into the marketing term. They allow channels to be less saturated near the spike date.
We often use spikes to capture the effect of events like promotions, holidays, outages, and store closures. But spikes are just a modeling abstraction with their own limitations, and we often have to contend with those limitations in order for the model to get a useful read on the event.
What happens if we don’t use spikes?
If your model just looks like
depvar = intercept + marketing
and doesn’t have additive or saturation spikes, then of course it can only use the intercept and marketing to fit the dependent variable.
Often the model will simply not fit large spikes in the depvar.
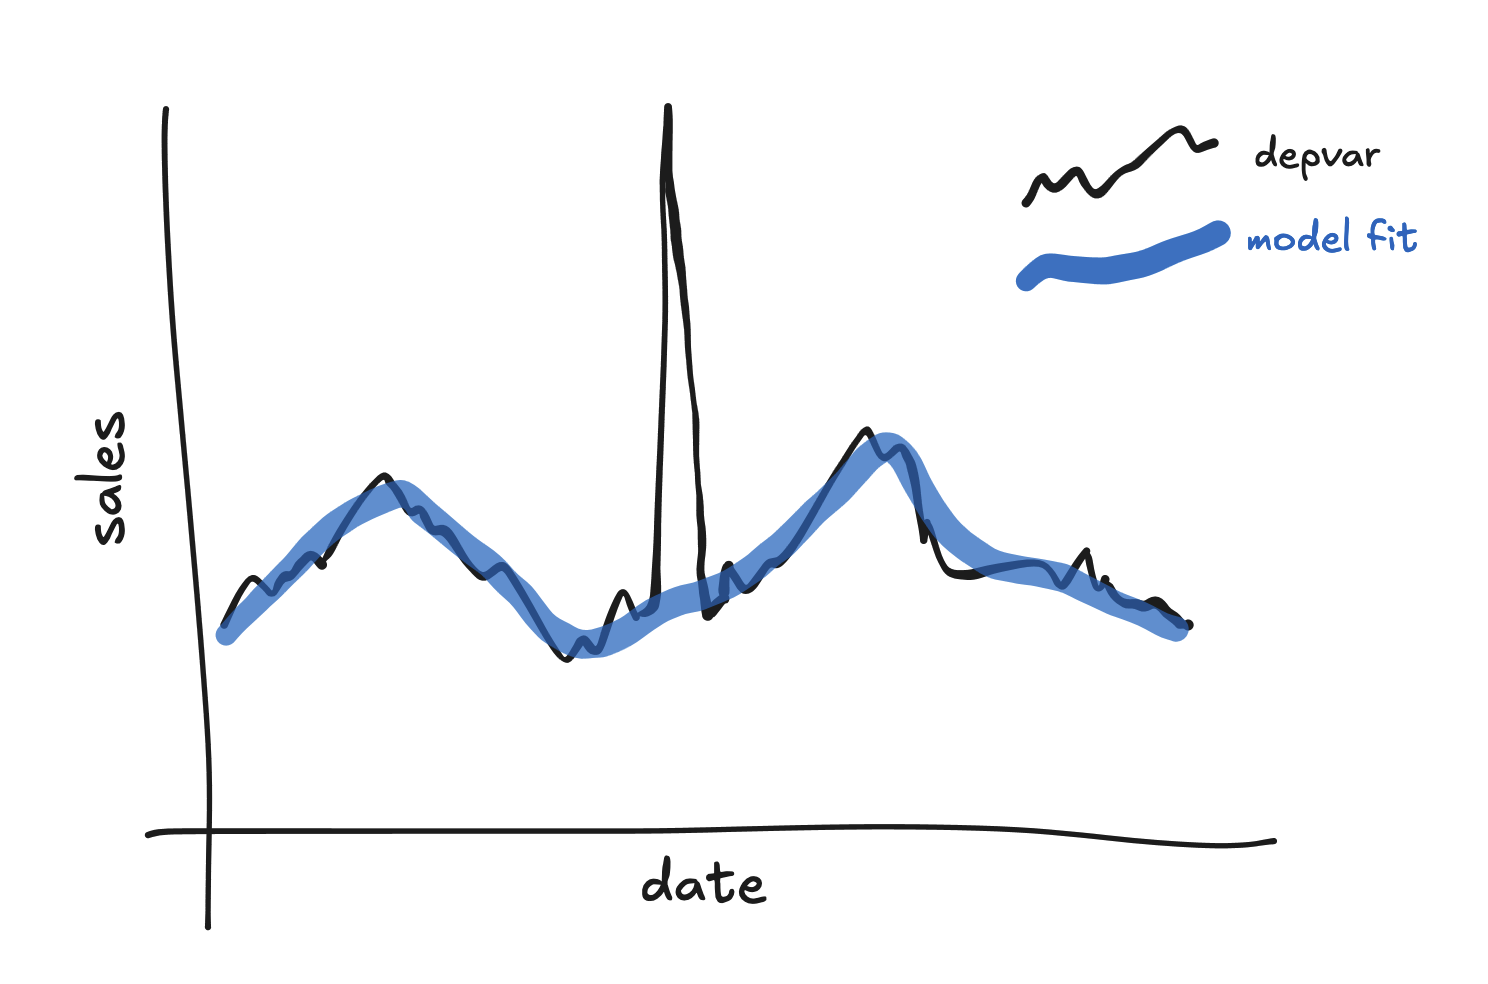
Every missed spike like this increases the residual variance and loosens the model fit! If a model has many large misses like this then its large error term will cause it to be less sensitive to typical day-to-day variation in the depvar.
There is, of course, a balance to be struck. If we placed a spike on every single date, then the model would fit the depvar perfectly, but the model would be useless.
Prefer parsimony.
In rare cases, the spend in one or more channels may line up with the depvar spike well, and the model may decide to use that channel to explain the spike. Whether this is good or bad depends on the cause of the depvar spike and the interpretation of the channel spend, but it’s generally a bad thing.
If a channel spend spikes during Black Friday, and the model doesn’t know about Black Friday, then the model may conclude that the channel caused the depvar increase on that date. In fact, the model may think that you can increase spend in that channel again at any time to create another Black Friday!
Spike shapes
Healthy additive spikes generally look like asymmetric versions of one of these four shapes (or their inverses, with the peak pointing downward):
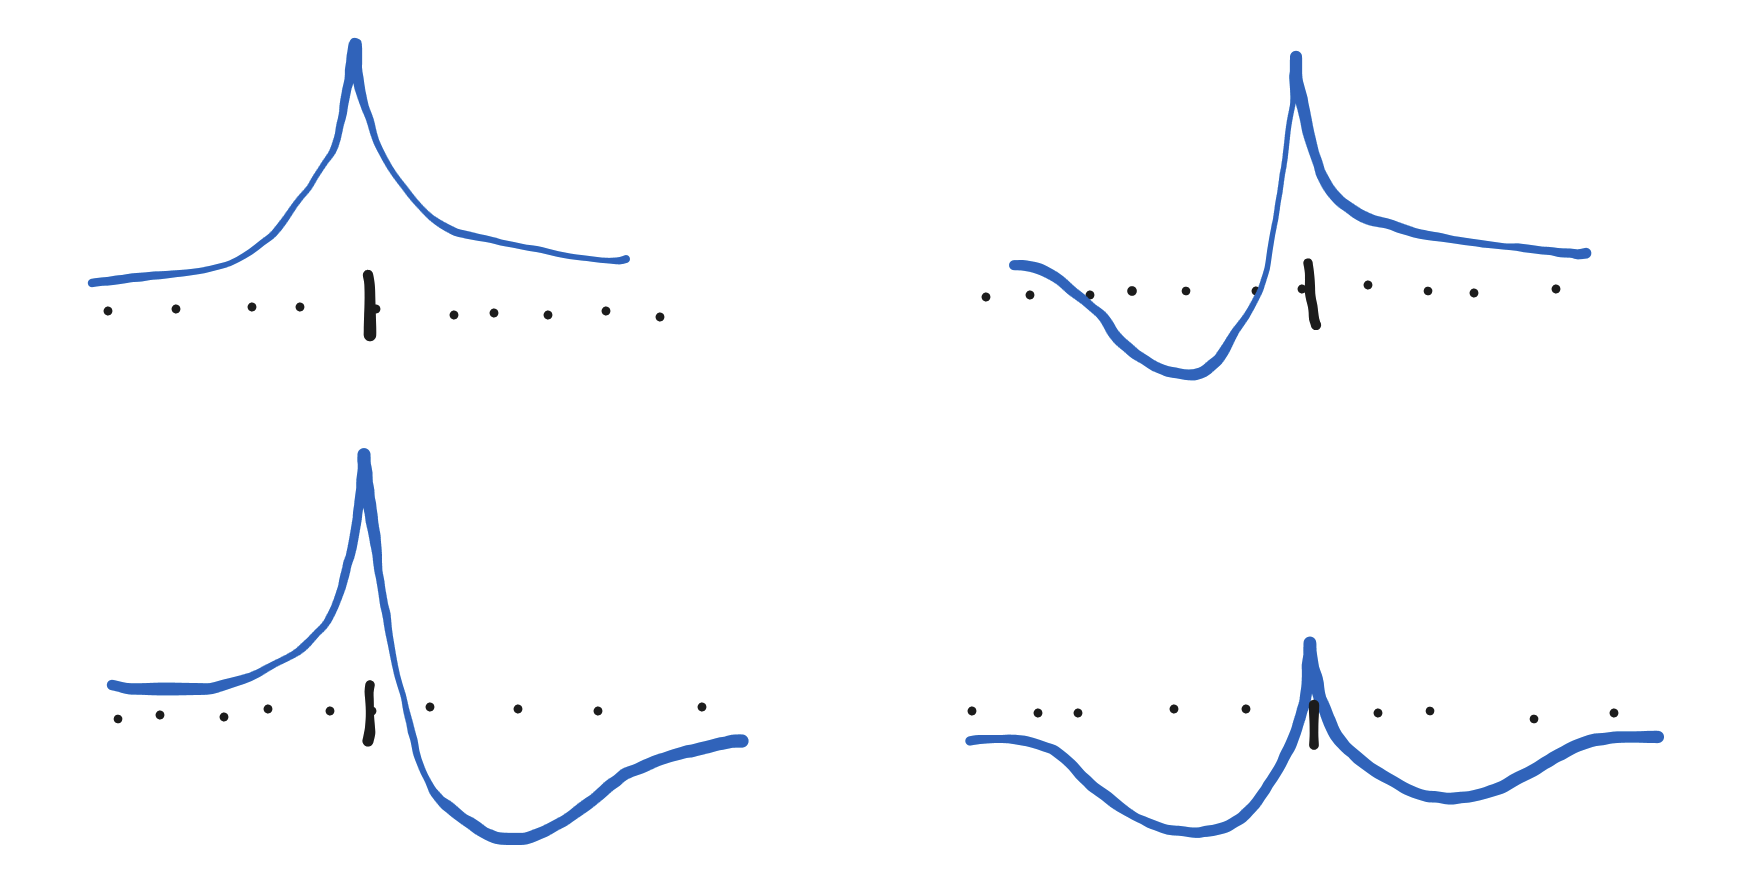
There are a few key features:
-
There is a single, isolated peak
-
Immediately on either side of the peak, the spike is convex (aka concave up)
-
An upward-pointing spike can be totally positive or it can have dips on either side of the peak. The peak itself may not even rise above zero.
Wherever you place a spike, it will flexibly become a shape like those pictured that best fits the data. But it can only take those shapes!
Saturation spike shapes
It’s worth talking about saturation spikes separately from additive spikes because, even though they use some of the same machinery, the types of depvar shapes they fit are somewhat different.
What are saturation spikes, though?
Under the hood, saturation spikes are modeled using only the positive parts of the spike machinery, so they always look like asymmetric versions of this:
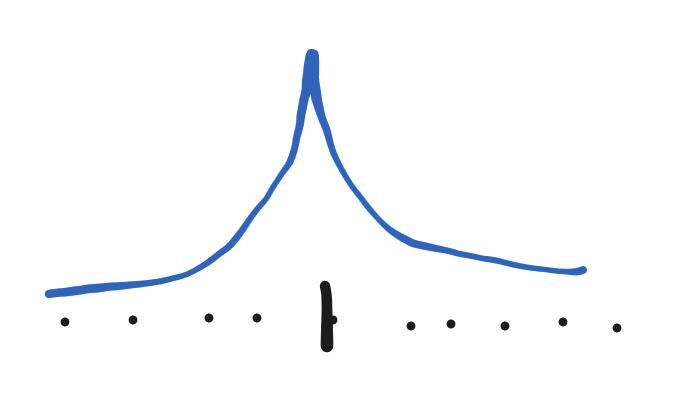
They multiply against each channel’s saturation parameter 'k' inside the spend-response function:

By making the saturation parameter larger, the spend-response curve straightens out, so the channel can accept more spend before reaching diminishing returns:
In all new models, we time shift the saturation spikes backward into the past for each channel. We call this a back-convolution. This process pushes the peak of the saturation spike into the past by some amount that differs for each channel (since each channel has a different time shift).
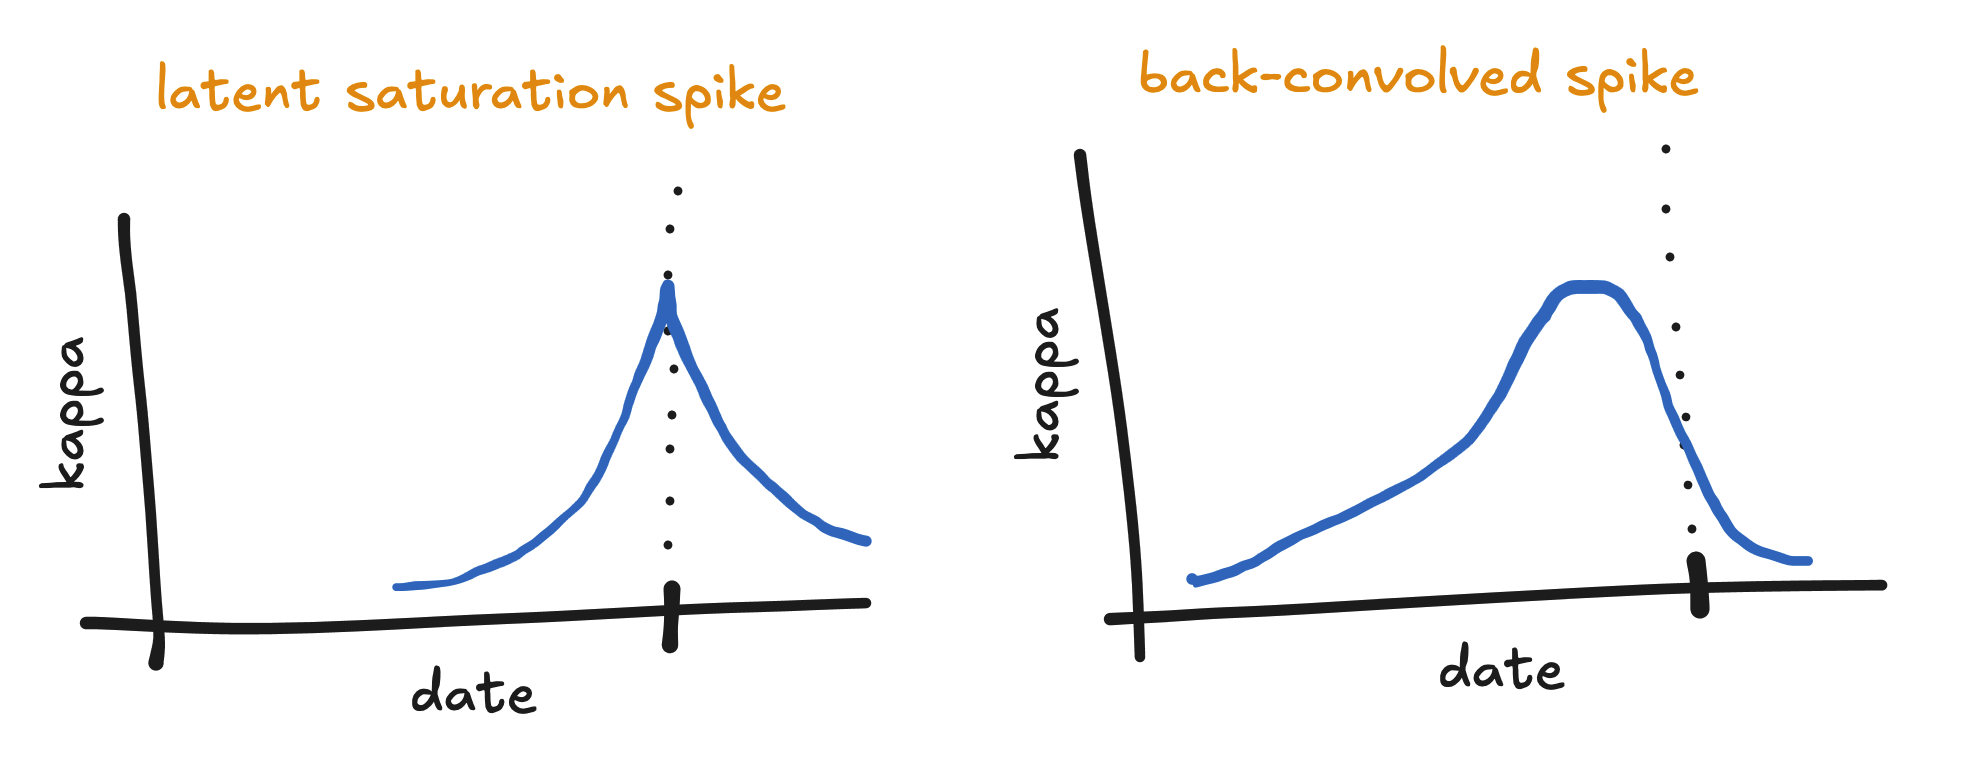
To see why we do this, suppose we have a saturation spike on the date of a promotion. If the time shift for a certain channel is one week, then the spend in that channel during the week leading up the promotion will presumably impact the amount of sales during the promotion. By back-convolving the spike, we apply the promotion bonus to the spend leading up to the promotion, rather than just to the spend on the day of the promotion.
Saturation spike shapes (finally)
Saturation spikes don’t fit depvar shapes in the same way that additive spikes do since they are wrapped into the marketing effect, and therefore the shape of their impact depends on spend. That said, we can imagine what would happen if spend was flat.
If spend is flat for every channel, then every channel will have flat impact:
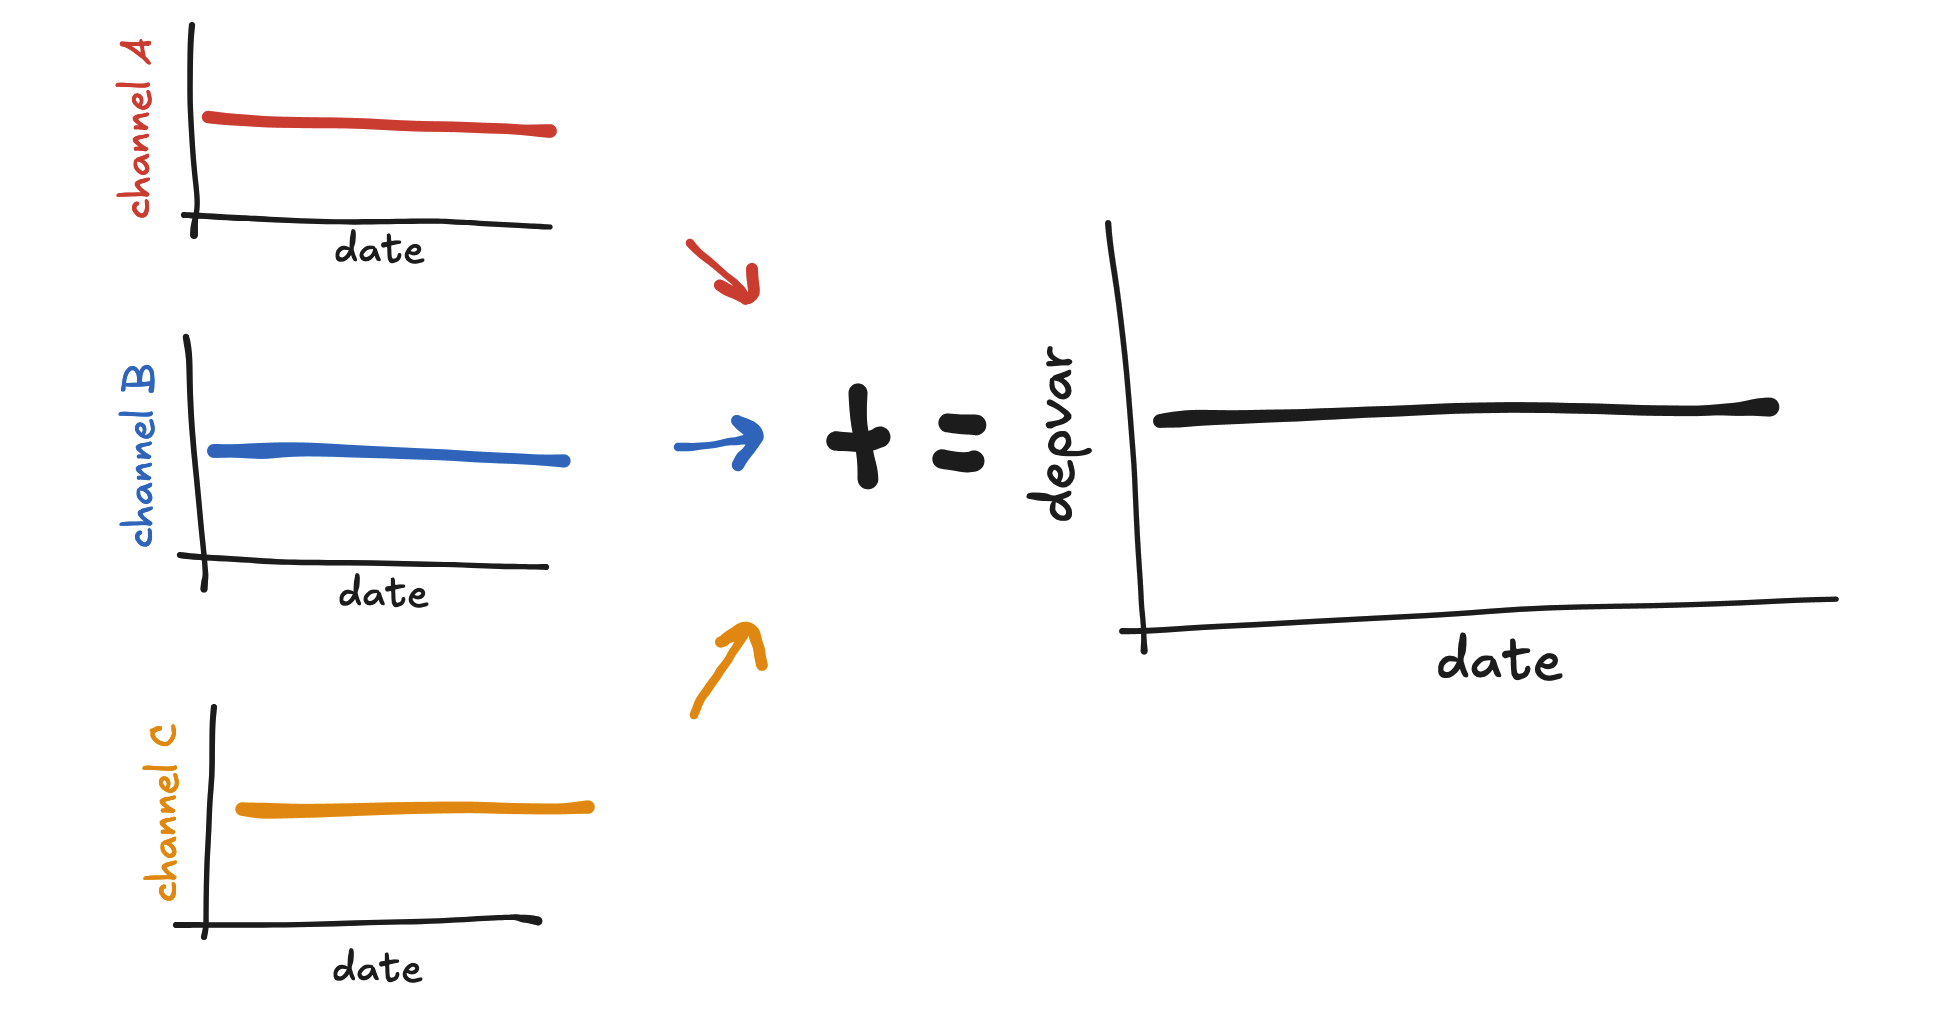
Now suppose we place a saturation spike in this time period. Suppose also that the time shift for channel A is the shortest, channel B has a medium time shift, and channel C has the longest time shift.
If we back-convolve the saturation spike, then each channel’s effect will look like a hump with its max located at the spike date. Further, channel A will have the narrowest hump and channel C will have the widest hump. As a result, the sum of their effects will look like a wide hump in the depvar, potentially with a sharp narrow peak on top.
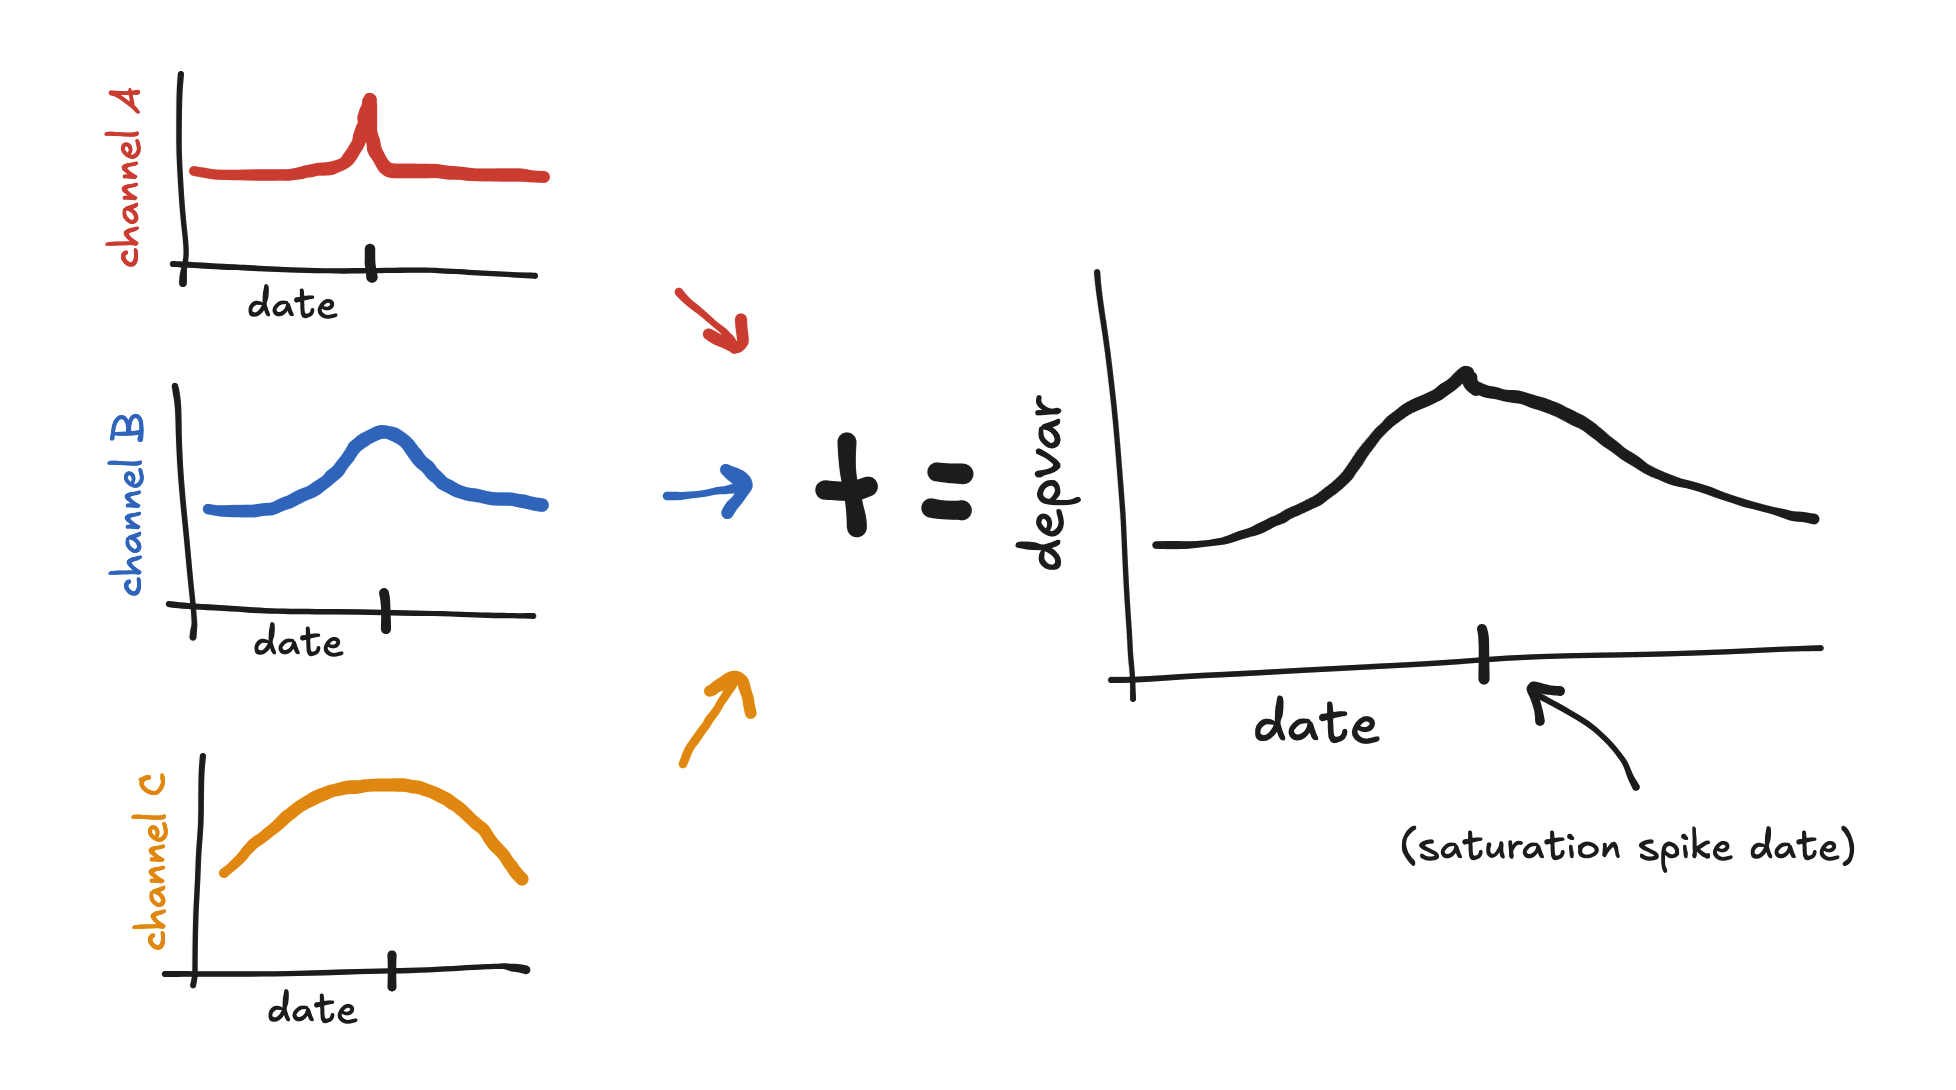
So, without spend variation, back-convolved saturation spikes tend to create these kinds of hump shapes in the predictor, and can help the model fit these kinds of shapes in the depvar.
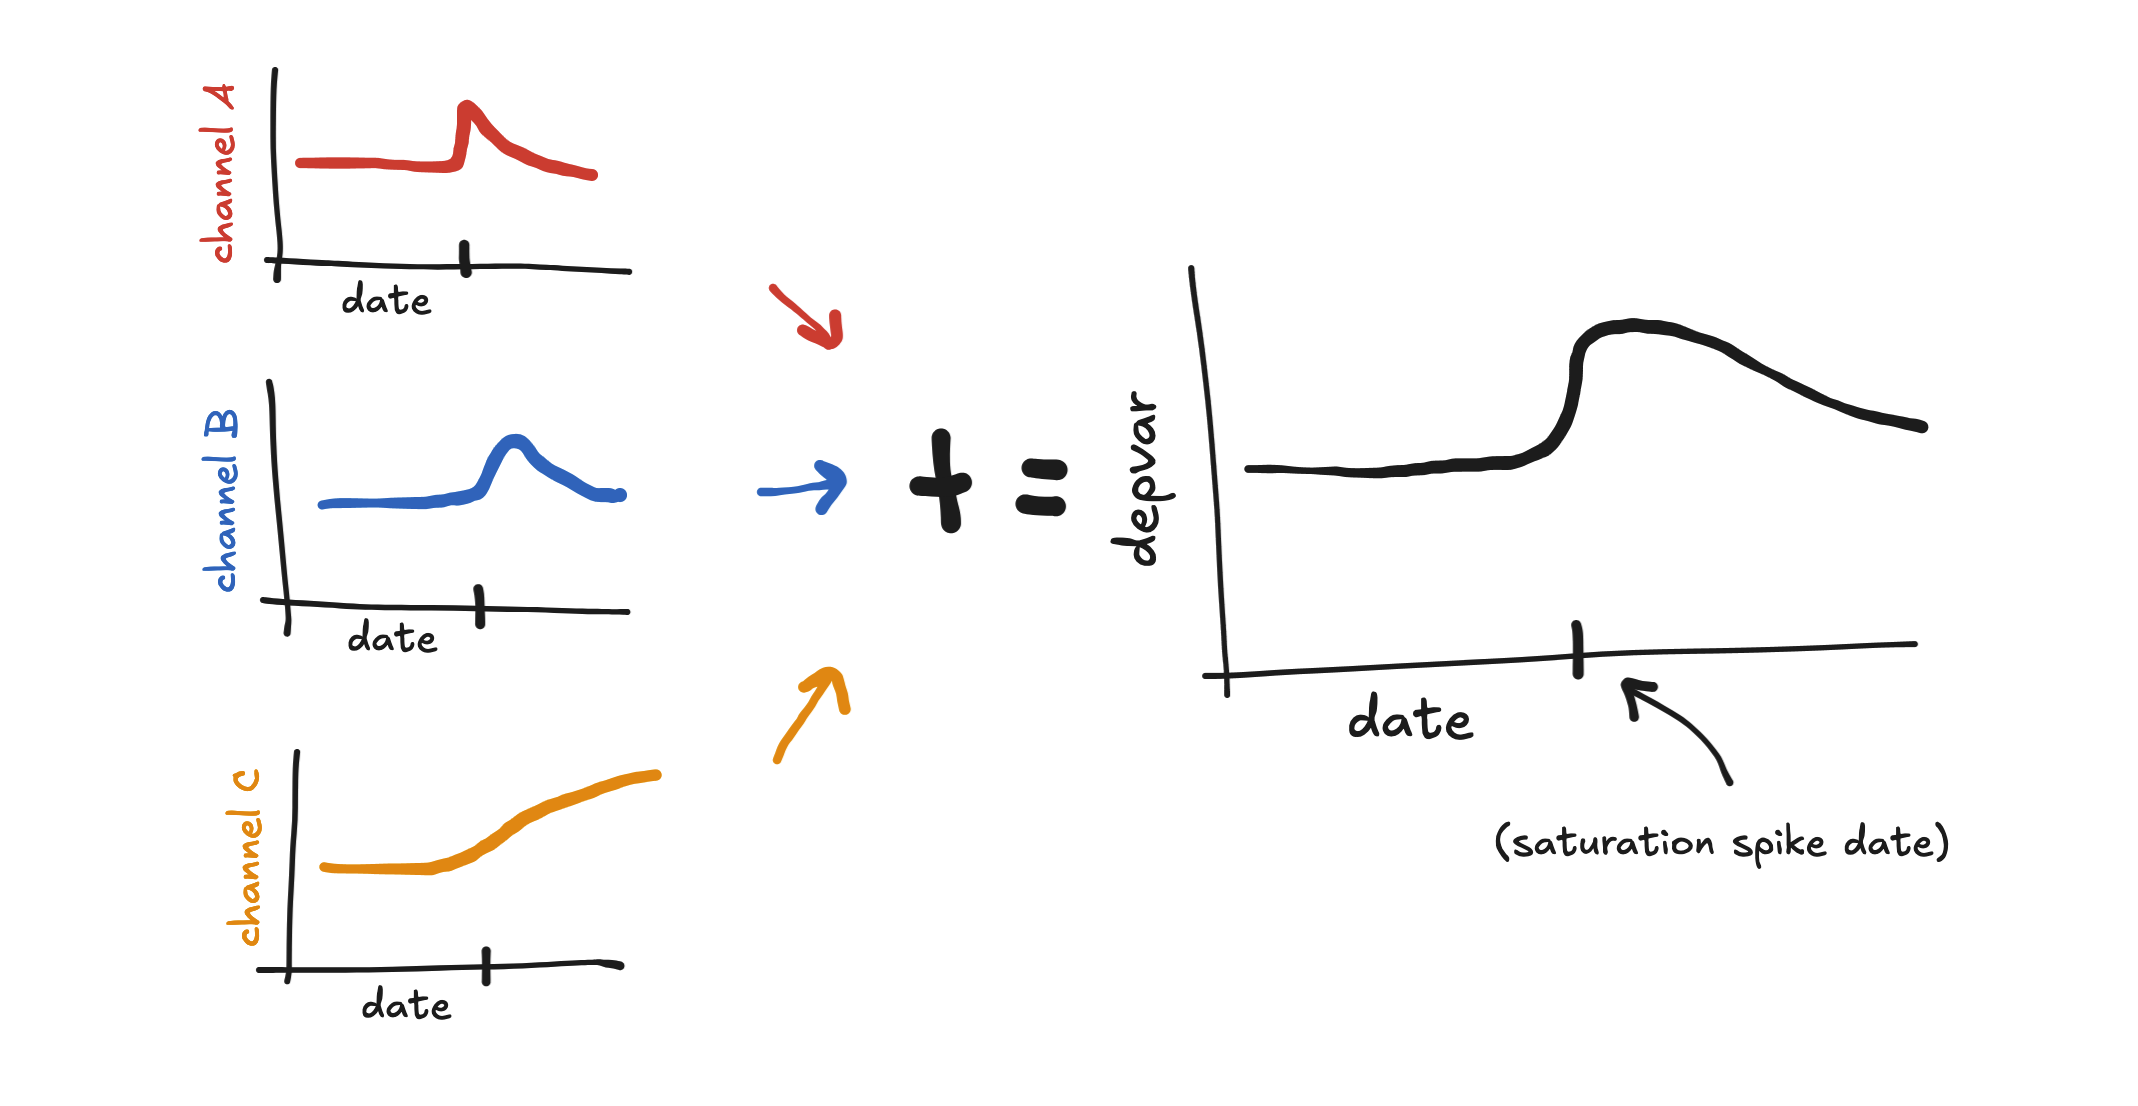
If we don’t back-convolve the saturation spike, then the spend on the date of the saturation spike benefits most, and so the most impact will be realized on the day of the spike and the days after. The effect of a saturation spike without back convolution can often look like a hill to the right of the spike date.
Grouping spikes
We can force the shapes of spikes to be similar by placing them in the same spike group. This can greatly improve the model’s in sample read and its forecasting power.
In sample, grouping spikes allows the model to pool information between spikes in a group, thereby helping the model distinguish what is “spike” from what is “not spike” near all of the spikes in the group.
For forecasting, spikes placed on some future date that are grouped with in-sample spikes will be forecasted to look like those in-sample spikes.
In general, spikes should be placed in the same group if a) the depvar has similar shapes near each spike and b) the spikes are causally similar. Condition b) might require discussion with the end users to understand.
When shouldn't we group spikes?
To understand when not to group spikes, try to imagine how the two benefits described above might actually cause issues.
Suppose you put two spikes in the same group, but the depvar near the first spike looks very different from the depvar near the second spike. Is it possible that the model might end up fitting neither well?
For example, suppose you use the same spike group for a spike near a small depvar spike and another near a large depvar spike. Generally the model will end up overshooting the small spike and undershooting the large spike.
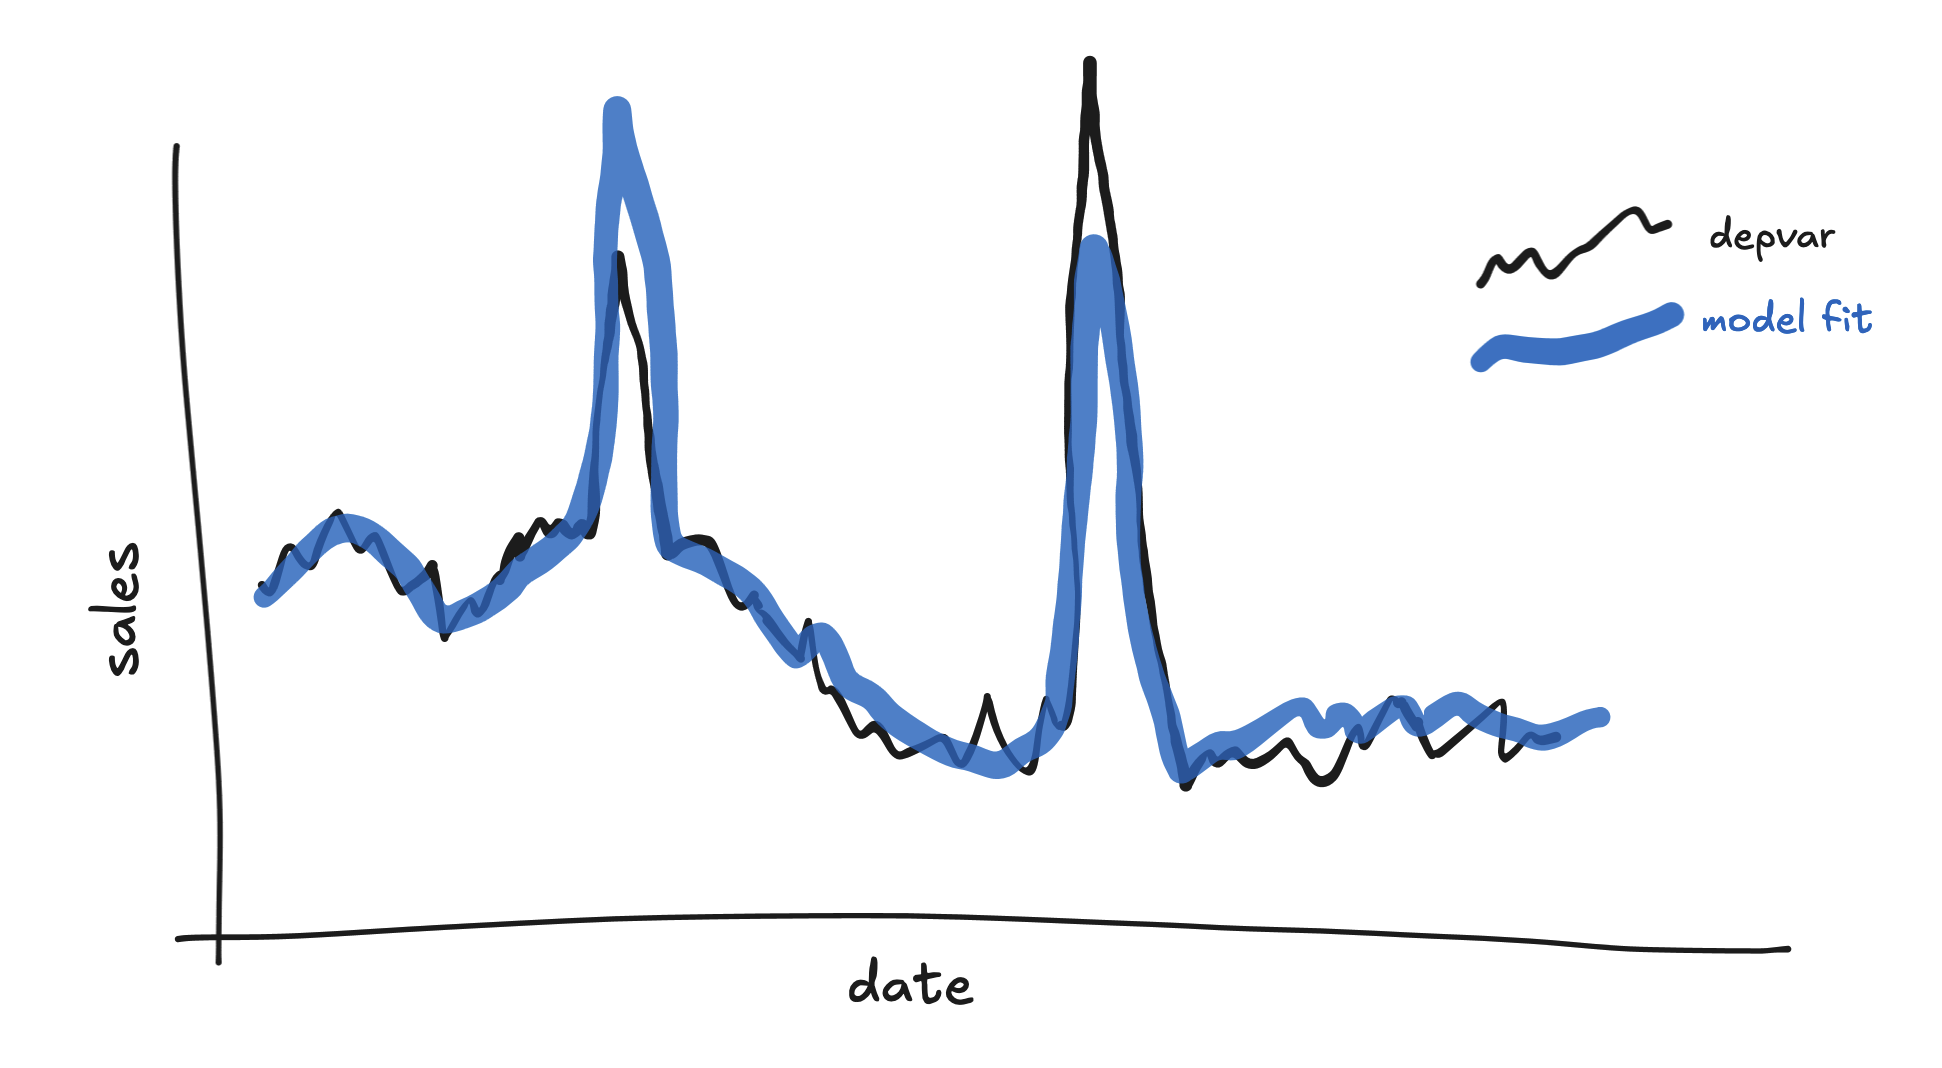
This might lead to large residuals and hence a more permissive error distribution, reducing the sensitivity of the model overall.
As for forecasting, remember that the model will average the in-sample spikes in a group when it forecasts a future spike in that group. If you have or the end users has reason to believe that the event corresponding to the future spike will not be causally similar to the events corresponding to the in-sample spikes, then the forecast may not be realistic.
Spike grouping strength
By default, the model forces spikes in the same group to be fairly similar. This is controlled by the parameters spike_similarity and spike_similarity_sat, which default to 100. Decreasing those values allow spikes in the same group to be less similar.
If you need to allow spikes to be less similar, setting one or both of those parameters to 75 is a good start. If you feel you need to reduce it even further, consider putting the affected spikes in different spike groups.
Common tricky depvar shapes (and how to handle them with spikes)
The two-day peak
Holidays and promotions often see sales to jump or dip on two consecutive days. For example, sales may be low on both Christmas Eve and Christmas Day.
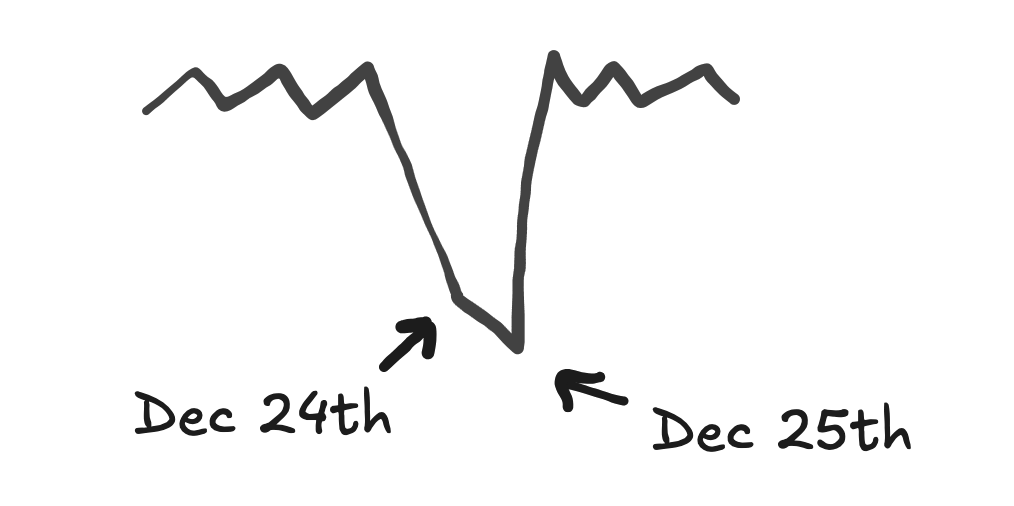
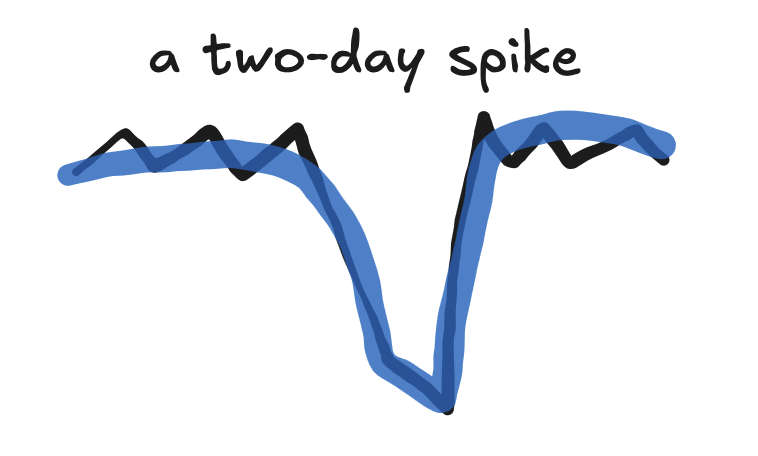
If you place a spike on only one of the two days, the model will not fit the other day. This is because of the strict convexity property of the spike near the spike date.

The day that wasn’t fit will generally result in a large residual and so increase the size of the model’s error term.
Placing two spikes, one on each day (usually using a single row in airtable with a Start Date on the first day and End Date on the second day), will usually work well.
The "BFCM"
Many businesses have spikes on both Black Friday and Cyber Monday. Often the depvar will dip downward before Black Friday and after Cyber Monday.
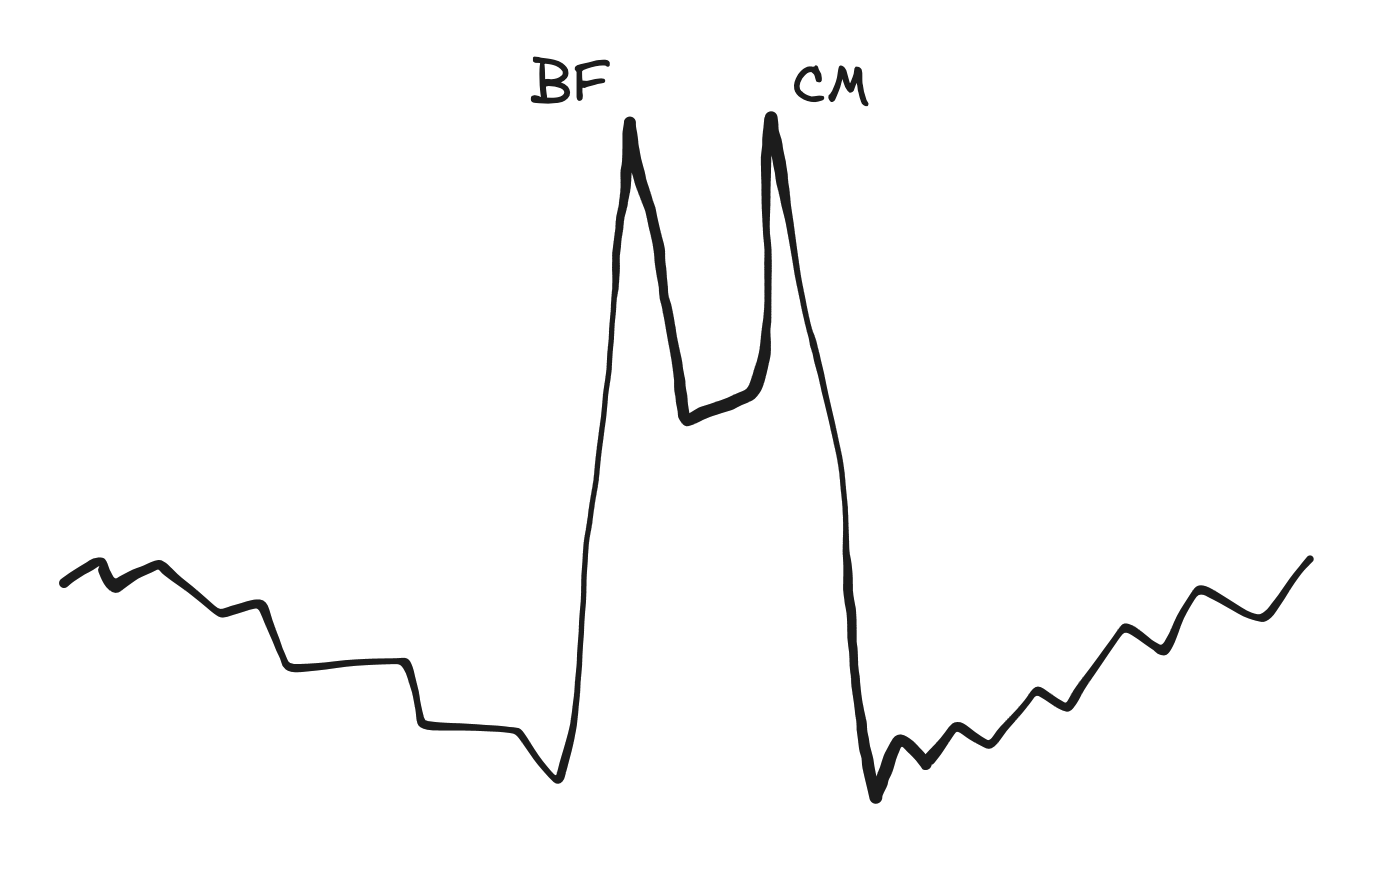
This is a common depvar shape whenever a big promotion or event lasts multiple days, and it should generally be handled by putting the first and second peaks in separate spike groups.
If you instead assign the two spikes to the same spike group, then the model will force those spikes to be similar. But the two peaks are actually quite dissimilar - one has a dip on the left side, and the other has a dip on the right. The final spikes in the model will basically be a compromise between the two depvar spike shapes, and the model not fit the depvar well.
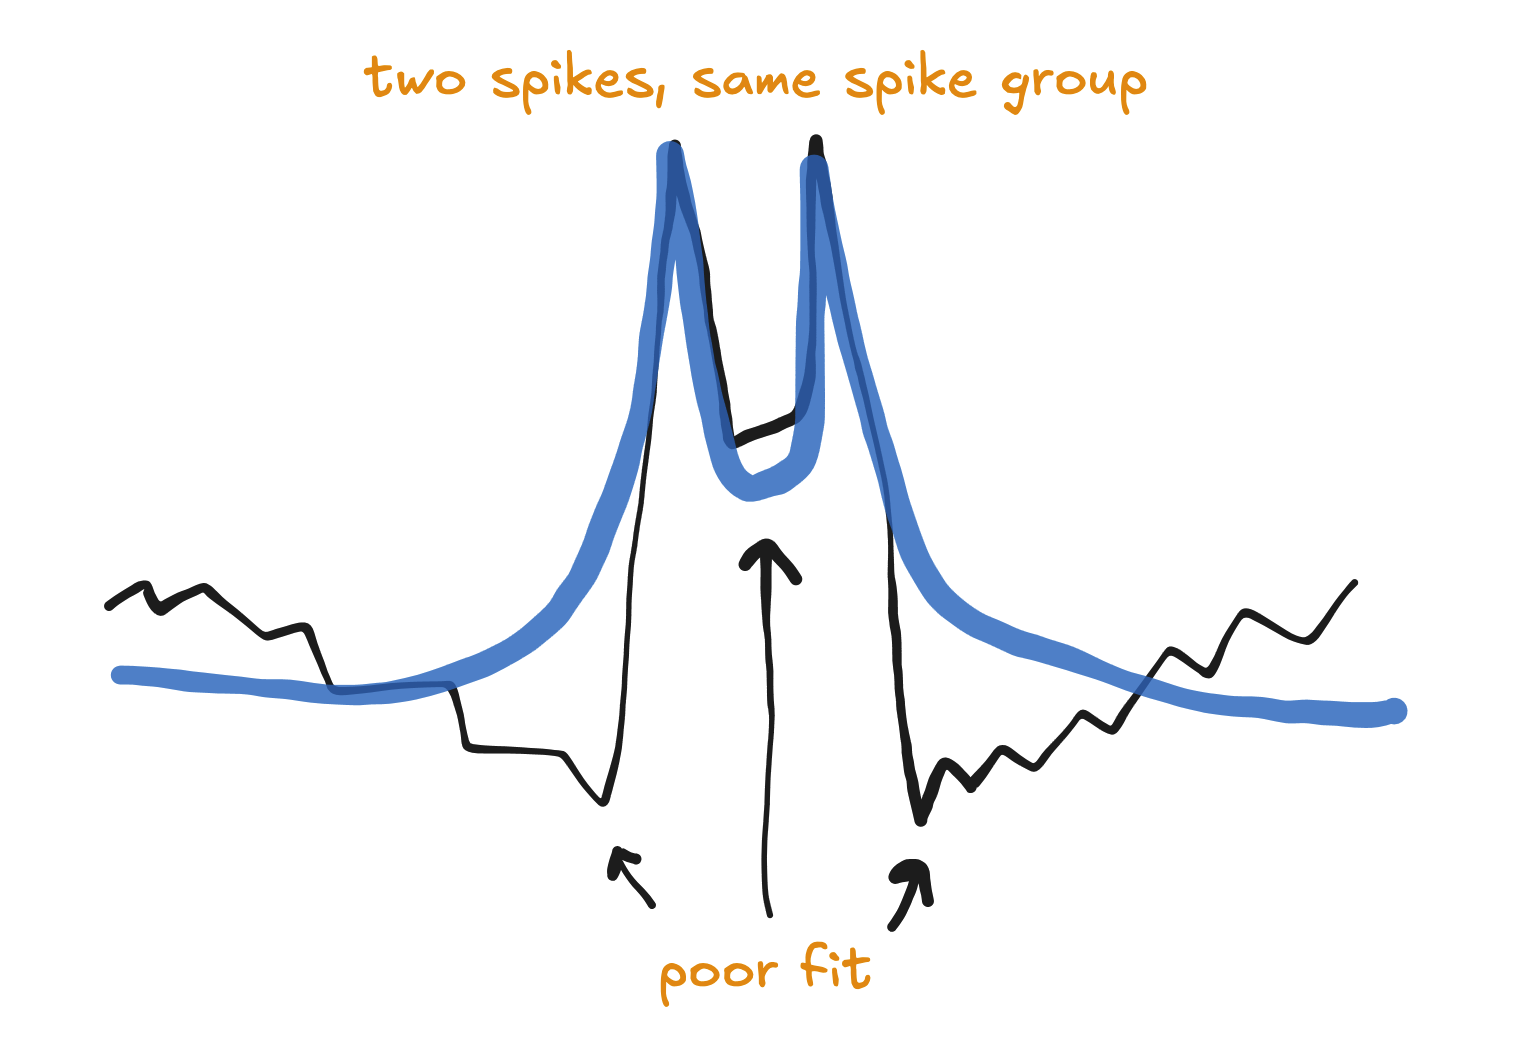
To avoid this, the simplest solution is to use a single row in the spikes airtable with the first peak in the Start Date and the second peak in the End Date.
The growing peaks
When a business grows, its sales during its promotions may grow proportionally.
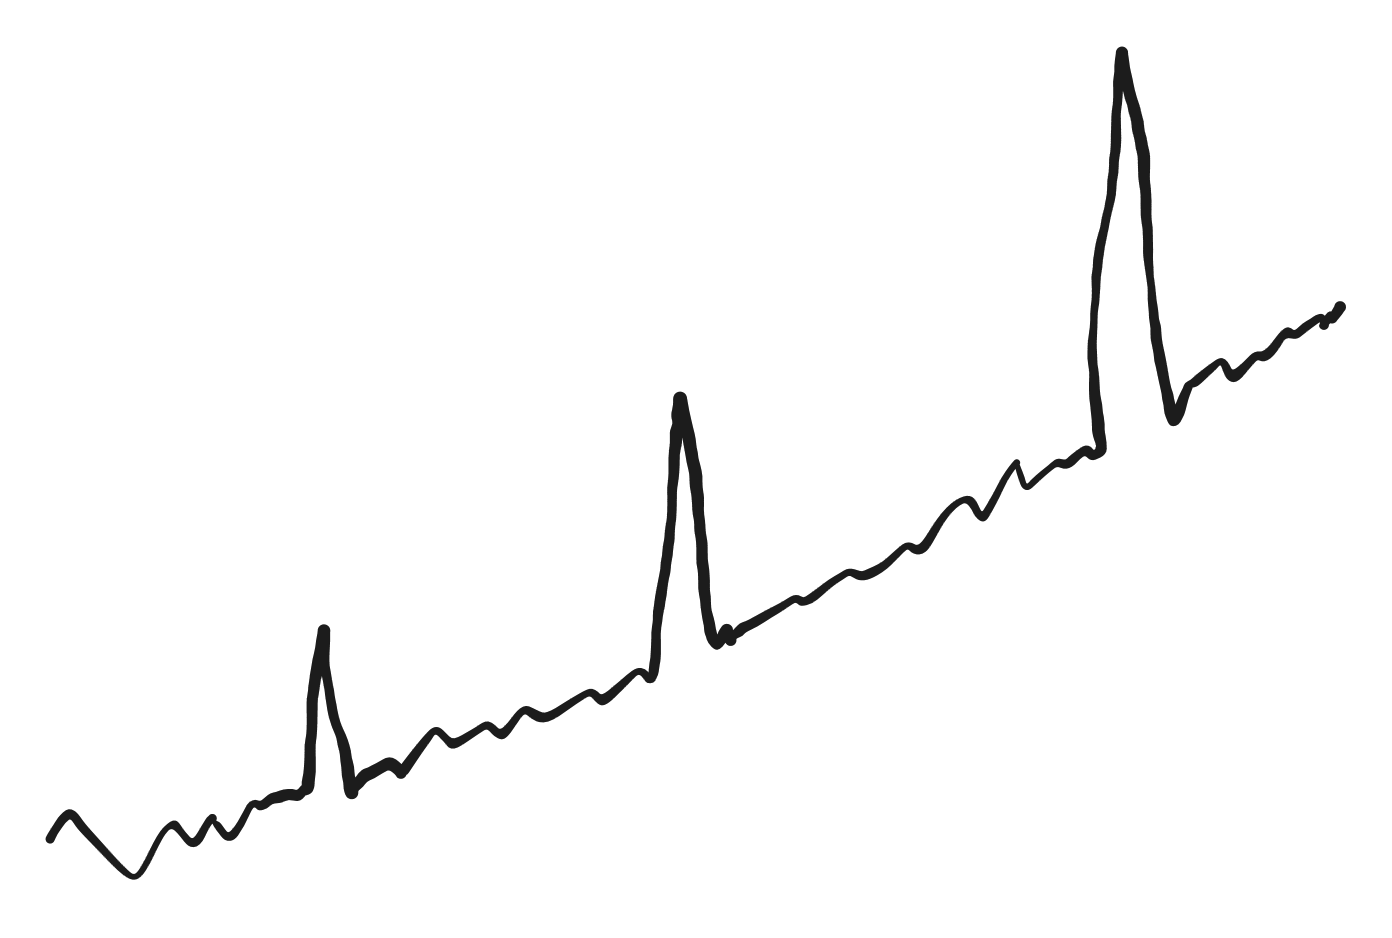
This is difficult to model and forecast just using additive spikes.
If you put them all in the same spike group, then take care that the model is not forcing the final spikes to be too similar. You may end up with an awkward compromise between the largest and smallest spikes, undershooting the largest spike and overshooting the smallest spike.
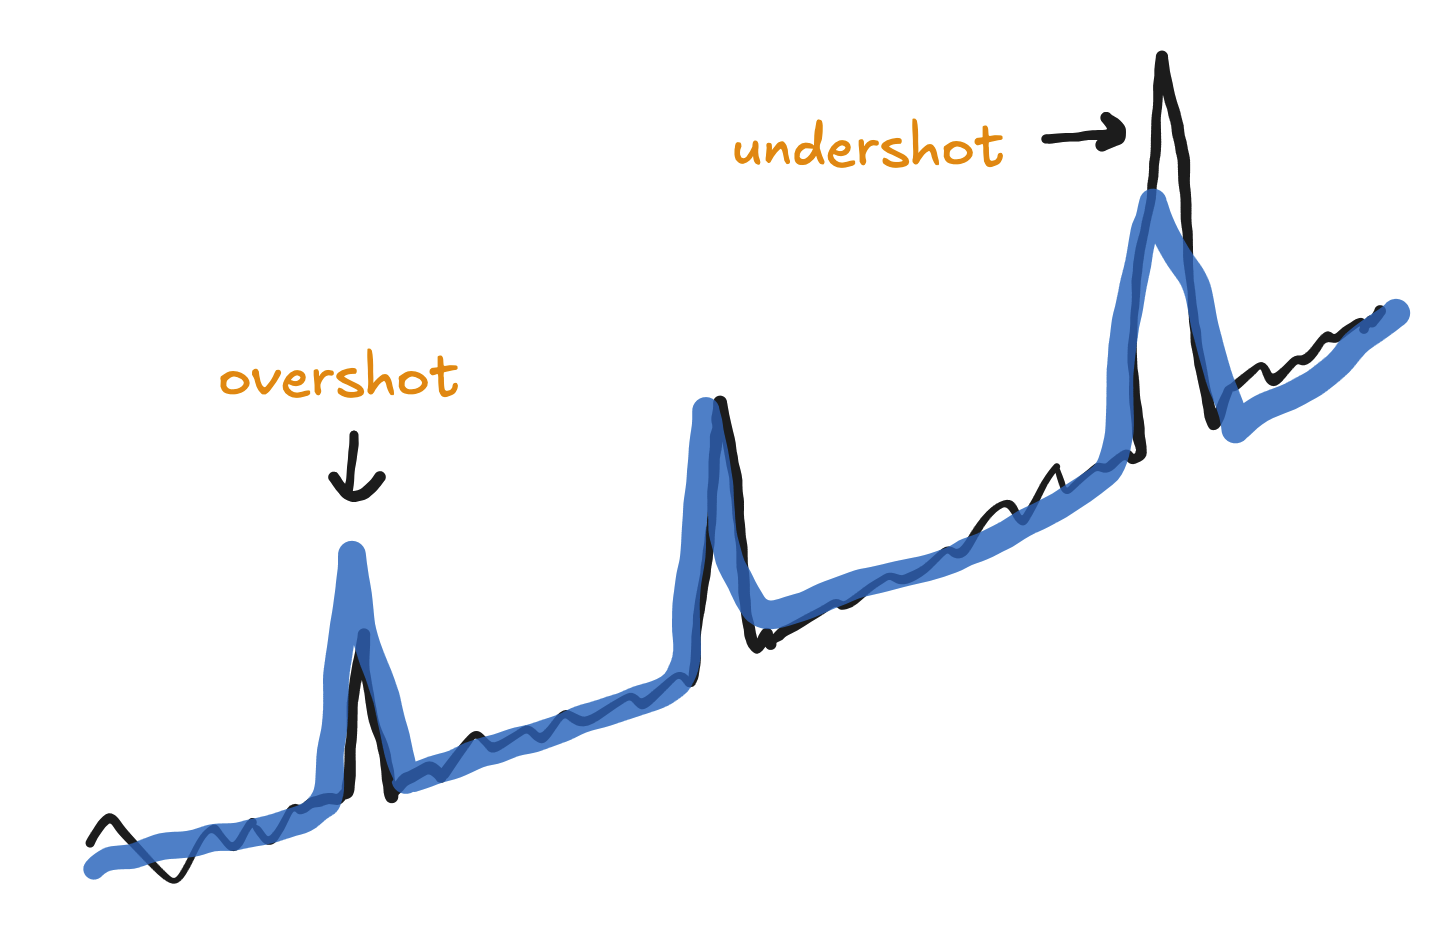
If you see this happening, and you definitely want to keep the spikes in the same spike group, then you can try reducing the spike grouping strength. That will allow the spikes in each group to vary more in size.
Note that this will not solve the issue of forecasting these spikes. The forecasted spikes will average the in-sample spikes, so if the future promotions are even bigger then their forecast will generally be too low.
The "Why won't this spike fit?"
When you add a spike in a model, it can sometimes not fit the depvar well at all!
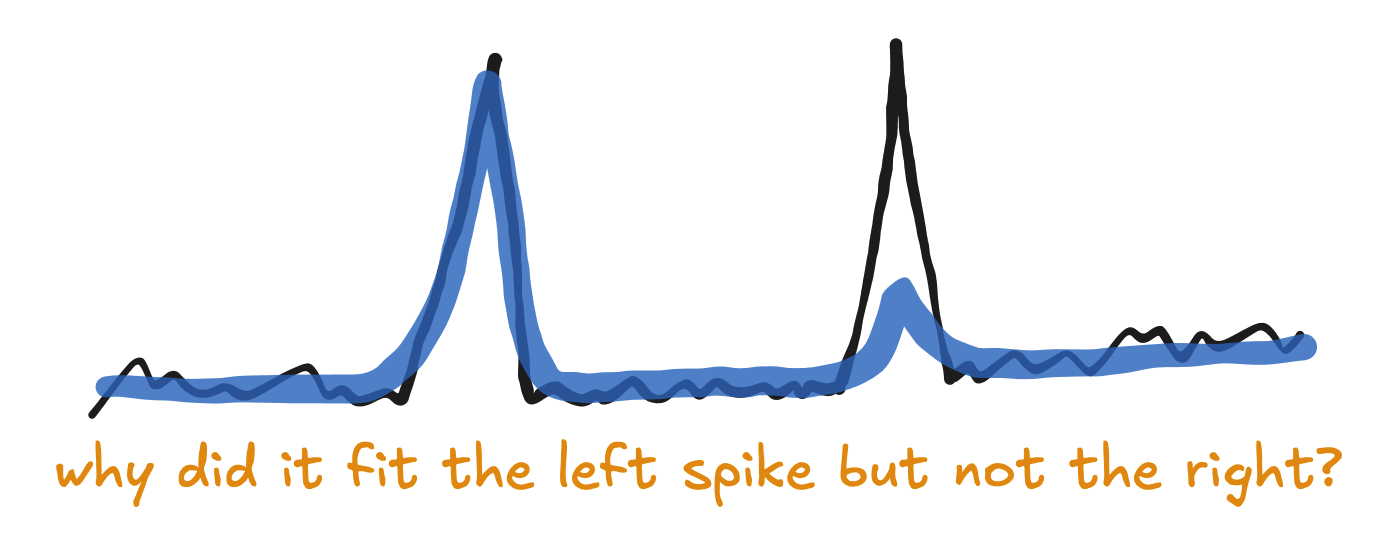
The answer often lies in the lower funnel channels.
Our model shares the same spikes between the depvar likelihood and the lower funnel likelihoods. If the previous spikes fit both the depvar and lower funnel channels well, but the new spike doesn’t fit the lower funnel channels well, then the model will assume that the spike is not as impactful as the previous spikes.
If you check the lower funnel channels near the spike that doesn’t fit the depvar, they will probably be pretty flat there.
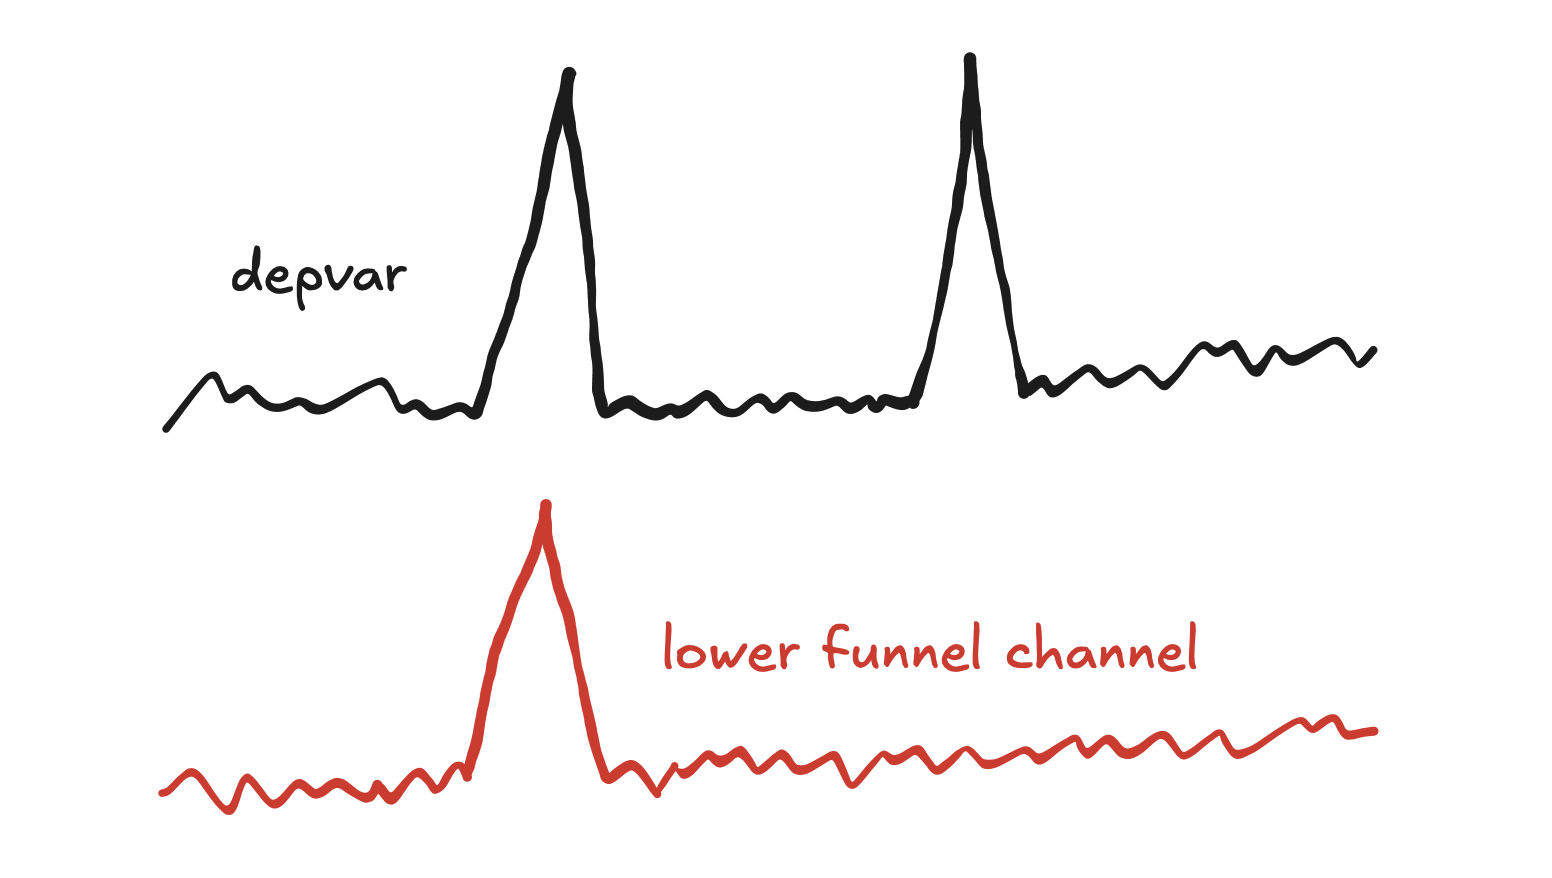
If you want the spike to fit the depvar well then you may need to disable the spikes component in the lower funnel models. You can do this by setting use_lower_funnel_spike_alpha to 0 in OtherParameters. Note that this will generally result in a model that doesn’t fit spend spikes in the lower funnel submodels.
Parting advice
-
Setting
spike_similarityand/orspike_similarity_satto 75 can often help with spike instability and fit, but consider carefully whether this will make the model too flexible. -
If you need to turn back-convolution off, consider the implications! Inspect the consequences carefully after turning it off.
-
Spike group names appear in the final dashboard. Consider making them human-friendly names (e.g. capitalize words, don’t use underscores, etc.). Be careful that they don’t include any weird Unicode characters, though. ASCII only!
-
Spikes tend to be greedy! If you put a spike somewhere where there isn’t an actual depvar spike, the model may use the spike to explain all of the variation near that point rather than using the intercept or marketing. It is surprisingly easy for a model to get a bad read on a poorly placed spike.
-
If a model has predictable spikes every year (e.g. holidays), add enough future versions of those spikes into the model so that a) the person maintaining the model doesn’t have to add them every year by hand and b) they are automatically pulled into forecasts and optimizations the end users will run.
-
A good rule would be to add spikes 3 years into the future. Our models currently support forecasts up to 2 full years into the future, and this will prepare it for at least another year beyond that.
-
-
If the spend and depvar data go back far enough, add spikes 180 days into the past as well. When you run a 180-day holdout, those dates will be in sample, and you should make sure to fit them well to give the 180-day holdout model the best chance to forecast well.
-
If the estimated additive spikes of a fitted model don’t look “spiky” (e.g. they look like long round hills), then they may be misplaced. Spikes should be placed on dates where the depvar is spike shaped.