Overview
Sub-channel analysis allows Recast to provide insights into specific campaigns within your parent channels. For instance, if the model recommends $1,000,000 for Meta in a given quarter, sub-channel analysis helps determine how the efficiency of each Meta campaign compares to the parent channel and the optimal distribution of spend across specific Meta campaigns.
Limitations
-
Results are relative only to their parent channel and are not time varying.
-
Sub-channel performance should be interpreted solely within its parent channel context, ranked against associated sub-channels. In the case where the same sub-channel is present under several parent channels, Recast recommends simply comparing how the sub-channel ranks relative to each parent channel.
-
Additionally, result quality depends heavily on spend variation. Sub-channels with minimal spending fluctuation during the analysis period will show high uncertainty and should not inform decisions.
Sub-channel Relative Efficiency Plot
When estimating the performance of sub-channels over the analysis period* we get sub-channel performance indices - multipliers that tell us how efficient each sub-channel is compared to the parent channel.
The Sub-channel Relative Efficiency plot shows these performance indices with confidence bands and a reference baseline representing the average parent channel efficiency. Sub-channels performing above baseline are more efficient than the parent channel average, while those below baseline are less efficient.
This plot can be found on the relevant channel page in Insights and updates with every model refresh.
This plot should be interpreted directionally as the performance indices do not tell us the exact efficiency of the sub-channels but their ranked efficiency relative to the parent channel only.
Sub-channel Spend Over Time Plot
The Sub-channel Spend Over Time plot shows the historical spend for all sub-channels within a parent channel during the analysis period*. It can be found on the relevant channel page in Insights and updates with every model refresh. This visualization is essential to validate the relative efficiency as the linear regression methodology requires adequate spend variation to produce unbiased results. Make sure to refer to this plot for spend variation in the sub-channels of interest alongside viewing the Relative Efficiency plot.
*The analysis period is calculated over the last year by default but can be configured based on your preferences. Recast strongly recommends a minimum period of three months.
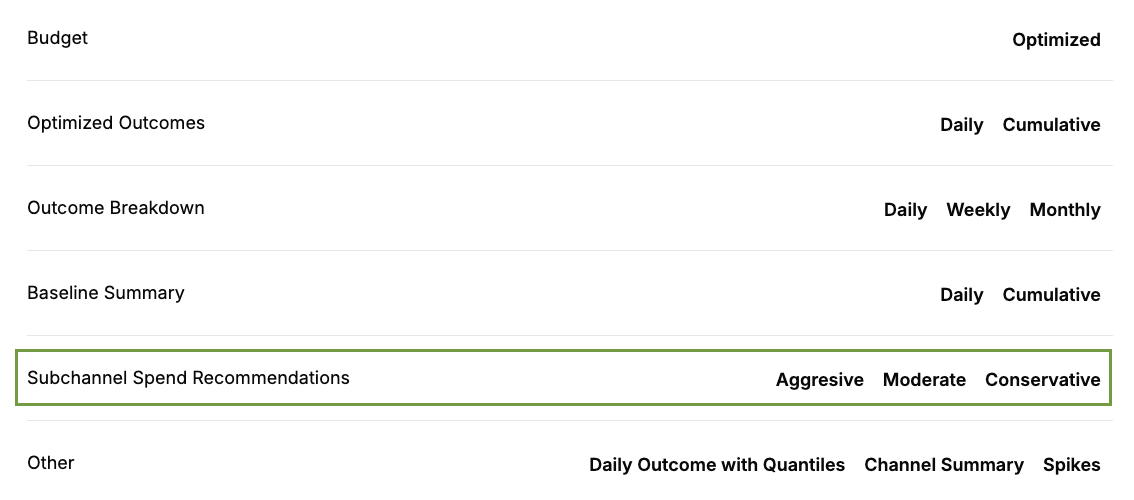
Sub-channel Spend Recommendations
When optimizing your spend, the Optimizer provides recommendations on how to allocate the optimized parent channel spend across your sub-channels. This can be found in the sub-channel section in the Optimizer downloads. The Optimizer uses sub-channel performance based on the last year of data by default. If you would prefer to use sub-channel performance for a different period such as the last 3 months, please speak to your Recast team.
These recommendations combine historical spend proportions with Thompson sampling weights, which count how frequently each sub-channel achieves the highest efficiency across all the model’s draws. The final recommendations blend the proportion of historical spend in each sub-channel with the Thompson sampling outputs:
-
Conservative: 98% historical spend, 2% Thompson sampling
-
Moderate: 95% historical spend, 5% Thompson sampling
-
Aggressive: 90% historical spend 10% Thompson sampling